Ishikawa Diagram
Last updated:
Ishikawa diagrams, also known as fishbone or cause-and-effect diagrams, organize potential causes of a problem into categories branching off a central spine. They are widely used in quality management and root cause analysis.
Syntax Highlighting
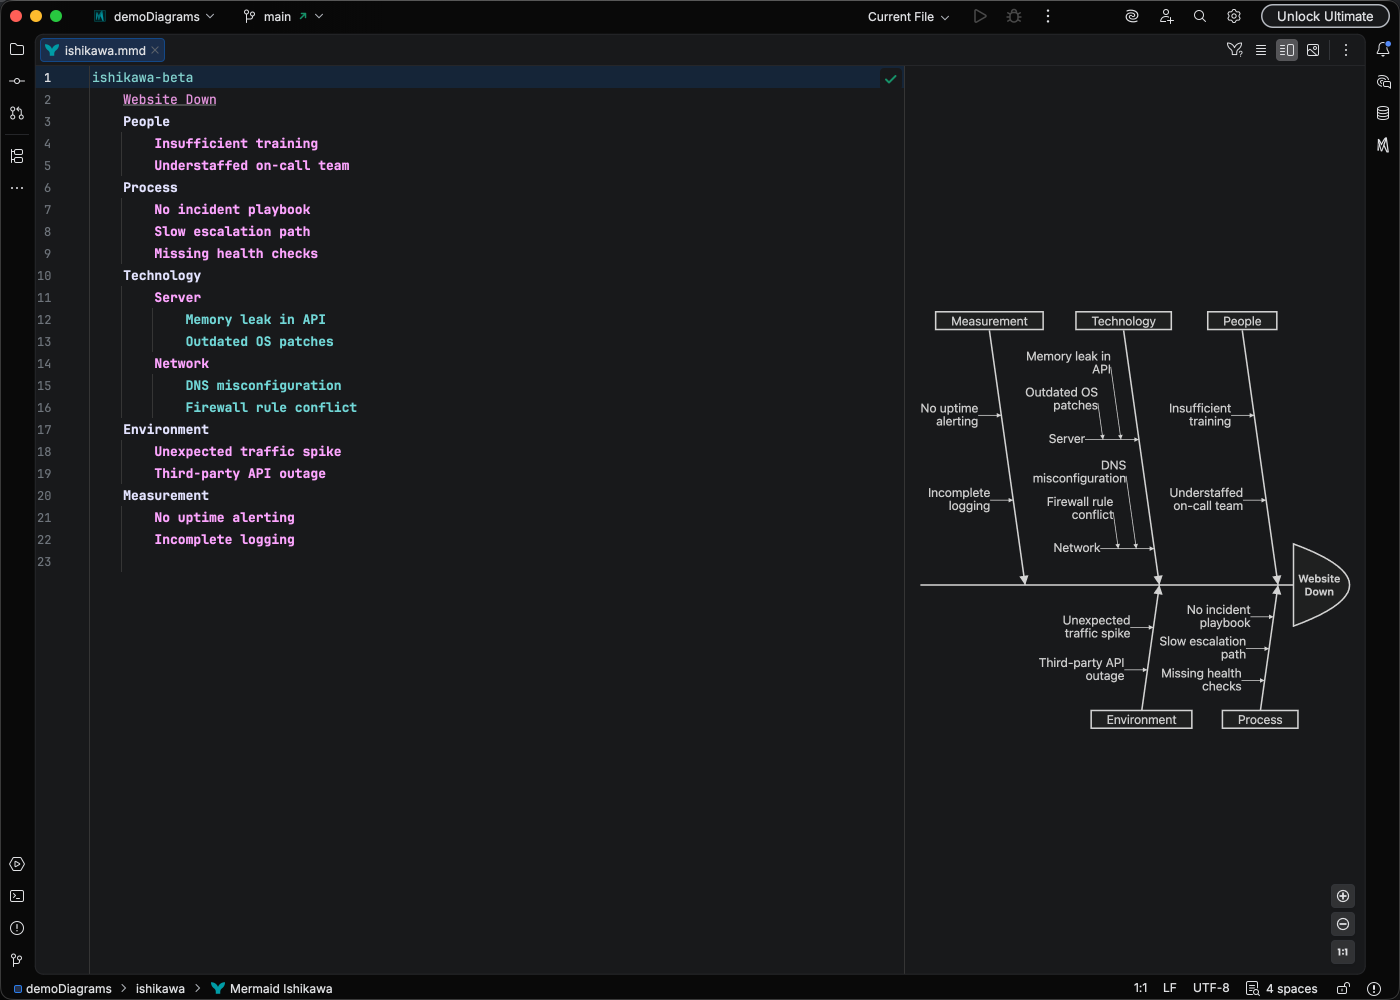
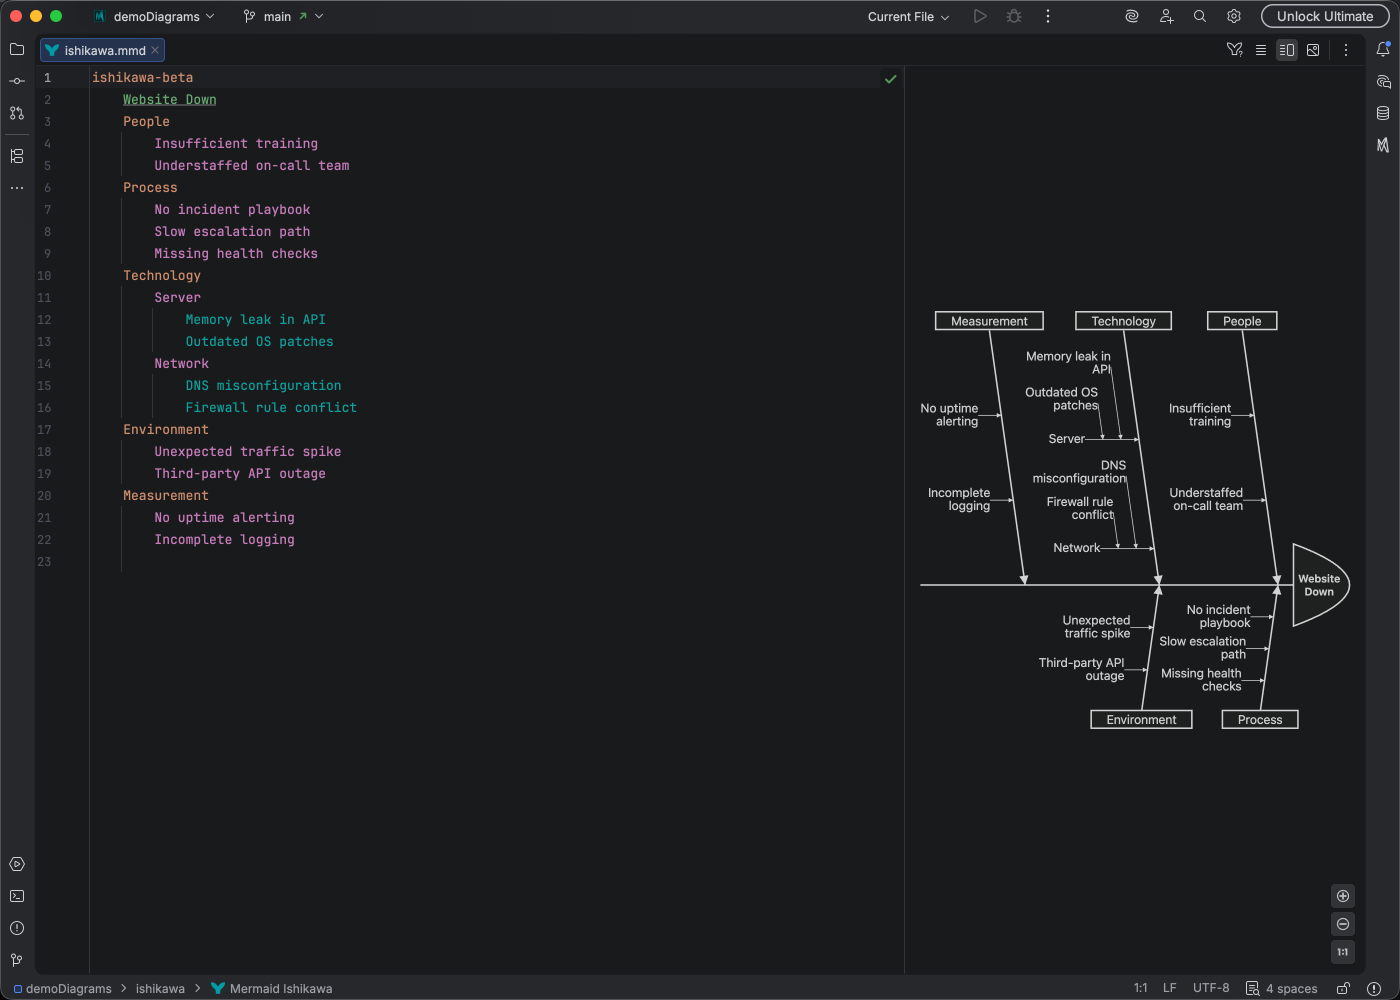
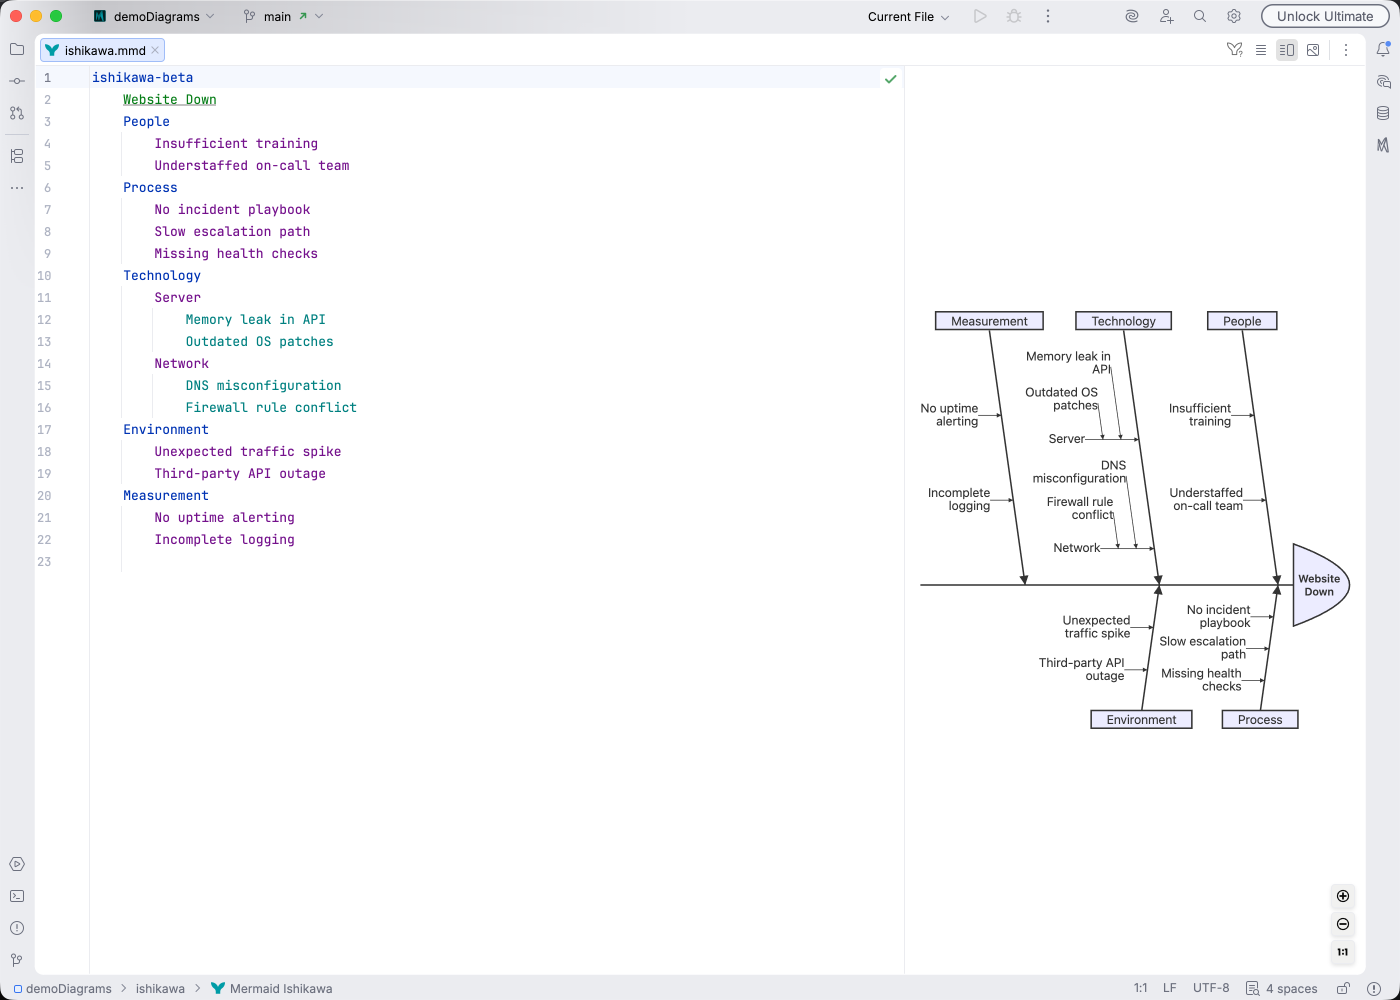
Section titled “Syntax Highlighting”Syntax highlighting integrates directly with IntelliJ’s color scheme system, so diagram colors always match your editor theme.
IDE Support
Section titled “IDE Support”Mermaid Studio provides comprehensive support for Ishikawa diagrams:
- Syntax highlighting with indentation-based depth highlighting that visually distinguishes cause levels
- Dedicated color settings page for customizing Ishikawa-specific highlighting
- Code folding to collapse cause branches
- Formatting to maintain consistent indentation
- Structure view for hierarchical overview of causes
- Navigation bar for quick access to diagram elements
- Inspections to catch structural issues:
- Blank line before event (error)
- Under-indented cause (warning)
Quick Syntax Reference
Section titled “Quick Syntax Reference”ishikawa-beta Website Downtime Infrastructure Server overload Network failure Software Memory leak Unhandled exception Process No monitoring Slow incident response People Insufficient training Key person dependencyKey elements:
- Start with
ishikawa-beta(orishikawa). Requires Mermaid.js 11.13.0+ - The first line after the keyword is the event - the problem being analyzed (the “head” of the fish)
- Subsequent lines are causes (the “bones” of the fishbone)
- Indentation determines hierarchy - deeper indentation creates sub-causes
- Use
<br>or<br/>for multi-line labels
For complete syntax details, see the Mermaid Ishikawa documentation.