Flowchart
Last updated:
Mermaid Studio provides the most comprehensive flowchart support of any IntelliJ plugin, turning your IDE into a first-class editor for process flows, decision trees, and system workflows. Flowcharts are the most versatile diagram type in Mermaid.js, and every piece of IDE intelligence in Mermaid Studio — completions, refactoring, inspections, Code Vision, and the Style Pane — is tuned for them.
Syntax Highlighting
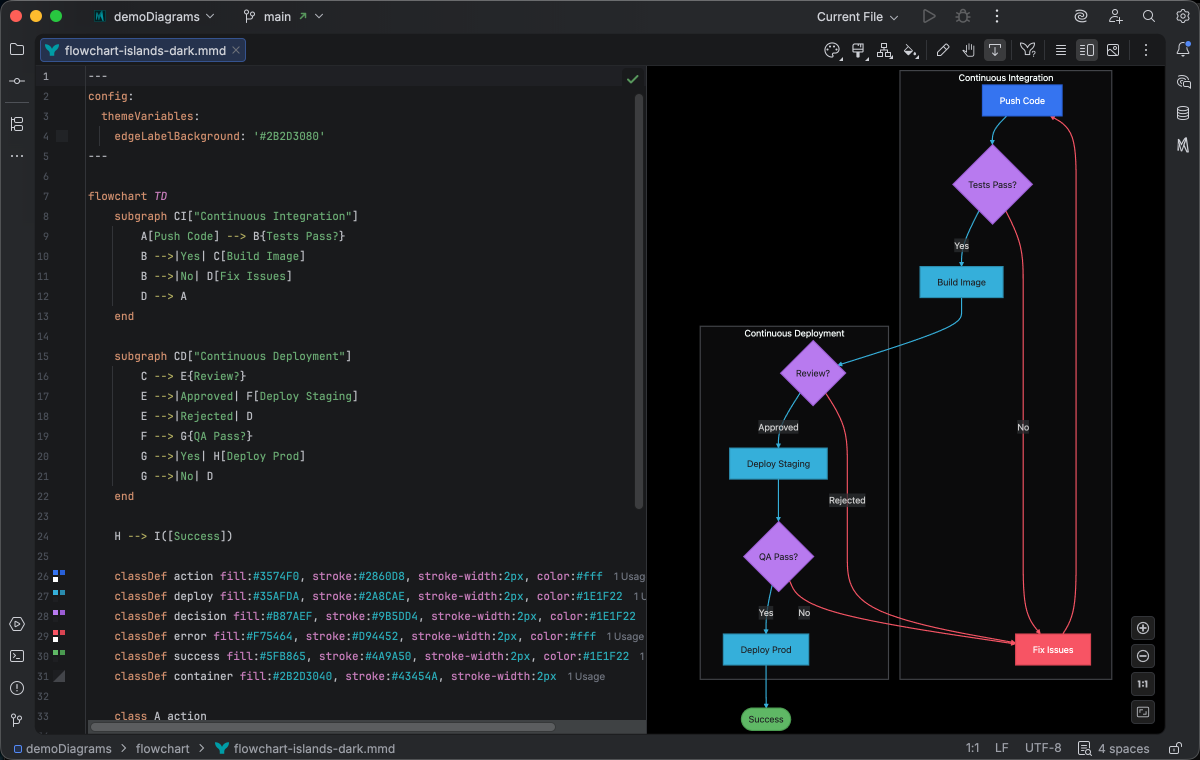
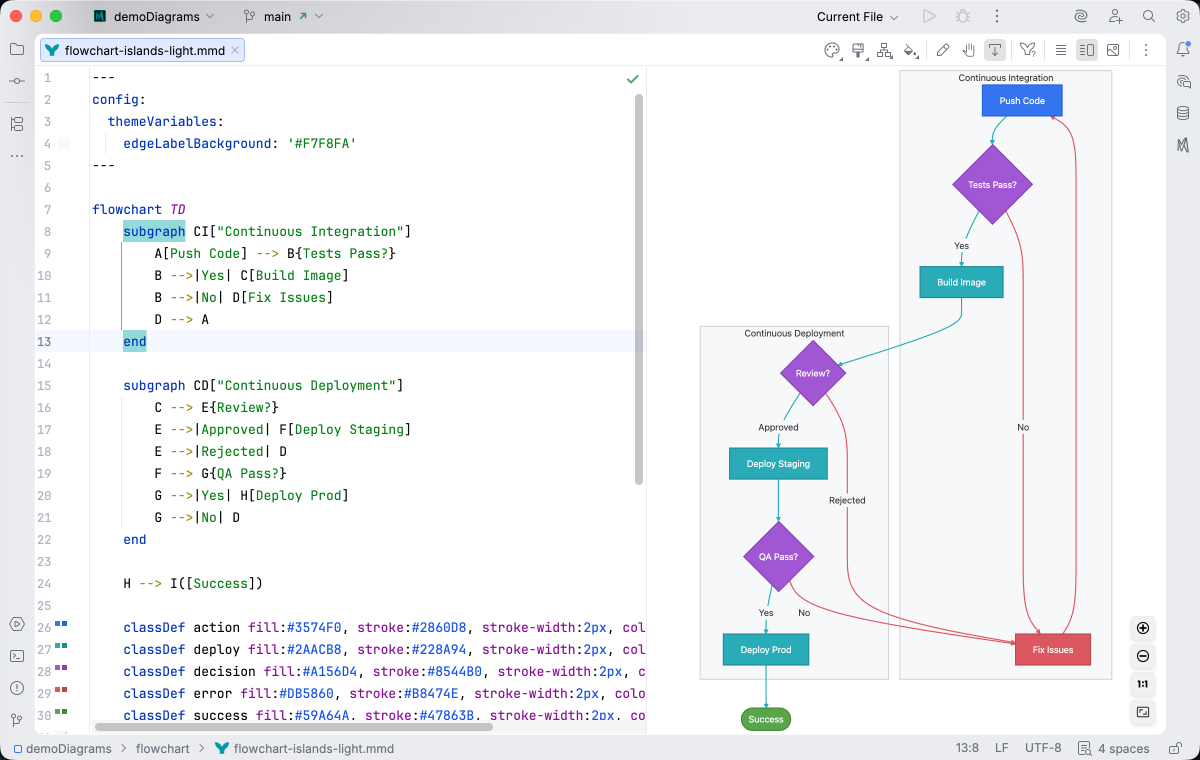
Section titled “Syntax Highlighting”Syntax highlighting integrates directly with IntelliJ’s color scheme system, so diagram colors always match your editor theme.
IDE Support
Section titled “IDE Support”Mermaid Studio provides comprehensive support for flowcharts:
- Syntax highlighting - Color-coded keywords, nodes, edges, and HTML tags in labels
- Code completion - Suggestions for node shapes, arrow types, keywords, and icons in generalized shapes
- Refactoring - Rename node IDs, subgraph IDs, CSS class names, and edge IDs across your entire diagram
- Find usages - See everywhere a node, subgraph, or CSS class is referenced
- Go to Related - Navigate between links and their
linkStyledeclarations, and fromlinkStyleindices to the declaring link - Code folding - Collapse subgraphs in large diagrams
- Formatting - Auto-format your diagram code with multiline string alignment
- Inspections - Detect undefined nodes, duplicate IDs, non-referenceable subgraph IDs, unclosed HTML tags, CSS class suffixes on generalized shapes, and more
- Brace matching - Navigate between paired brackets
- Code Vision - Relationship counts at a glance
- Color provider - See hex colors inline in style definitions
- Structure view - Hierarchical overview with subgraph nesting, node deduplication, and a unified Styles section
- Style Pane - Visual property editor with presets, node shape editing, and link styling controls
- Documentation - Hover with Cmd/Ctrl to see node labels, subgraph details, and type icons
- Navigation bar - Quick access to diagram elements with context-aware icons
Visual editing
Section titled “Visual editing”Flowcharts support the full visual editing surface. The toolbar’s Edit Mode toggle (pencil icon) flips the preview between preview mode and visual editing; the sections below cover the flowchart-specific actions available once it’s on.
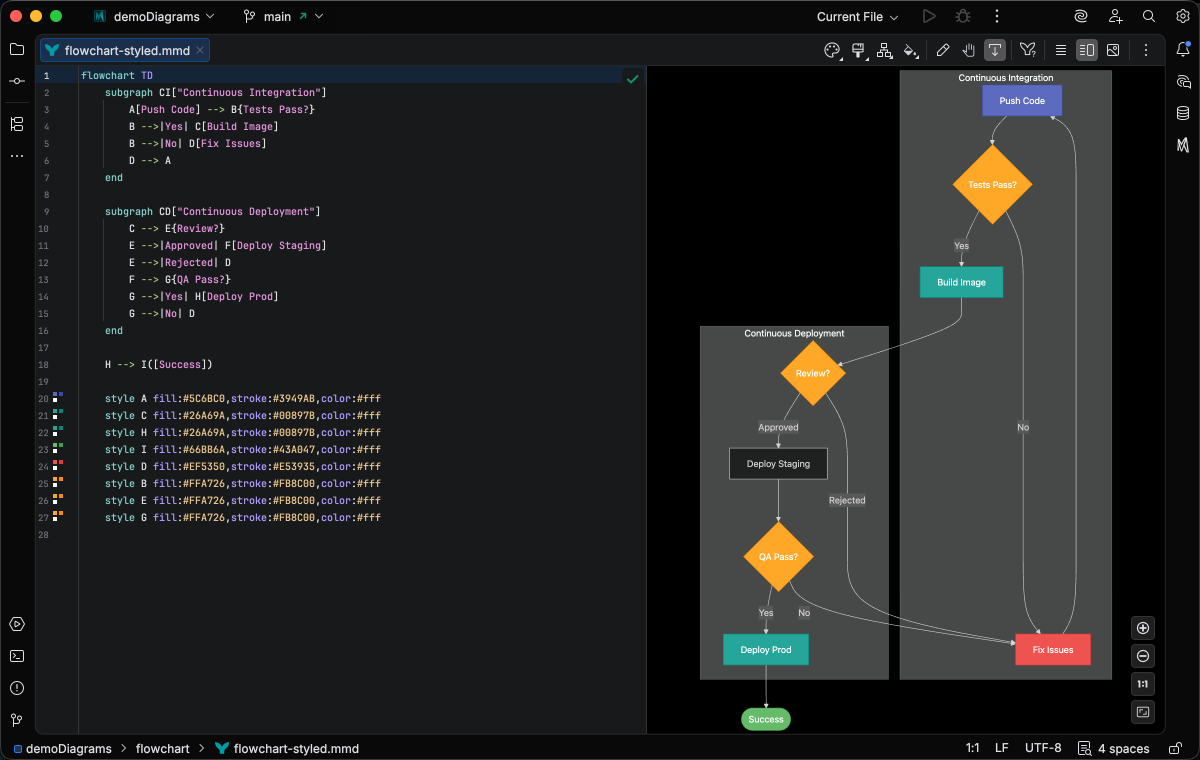
Style pane
Section titled “Style pane”The Style Pane covers flowcharts as a first-class diagram type.
Styleable elements include individual nodes, subgraph containers, links (edges, with linkStyle support), and classDef definitions.
Preset gallery
Section titled “Preset gallery”The preset gallery lets you apply reusable styles to the selected element. Select a node or edge, then pick a preset from the gallery to apply its styles. Built-in presets cover common styling patterns; you can also save your own.
Node shape editing
Section titled “Node shape editing”When a flowchart node is selected, the Style Pane shows a shape editor with:
- Shape selector — choose from available node shapes with SVG icons showing each shape visually.
- Arrow controls — configure the direction of connections into and out of the node.
Shape changes are written back to the diagram source as the appropriate Mermaid syntax.
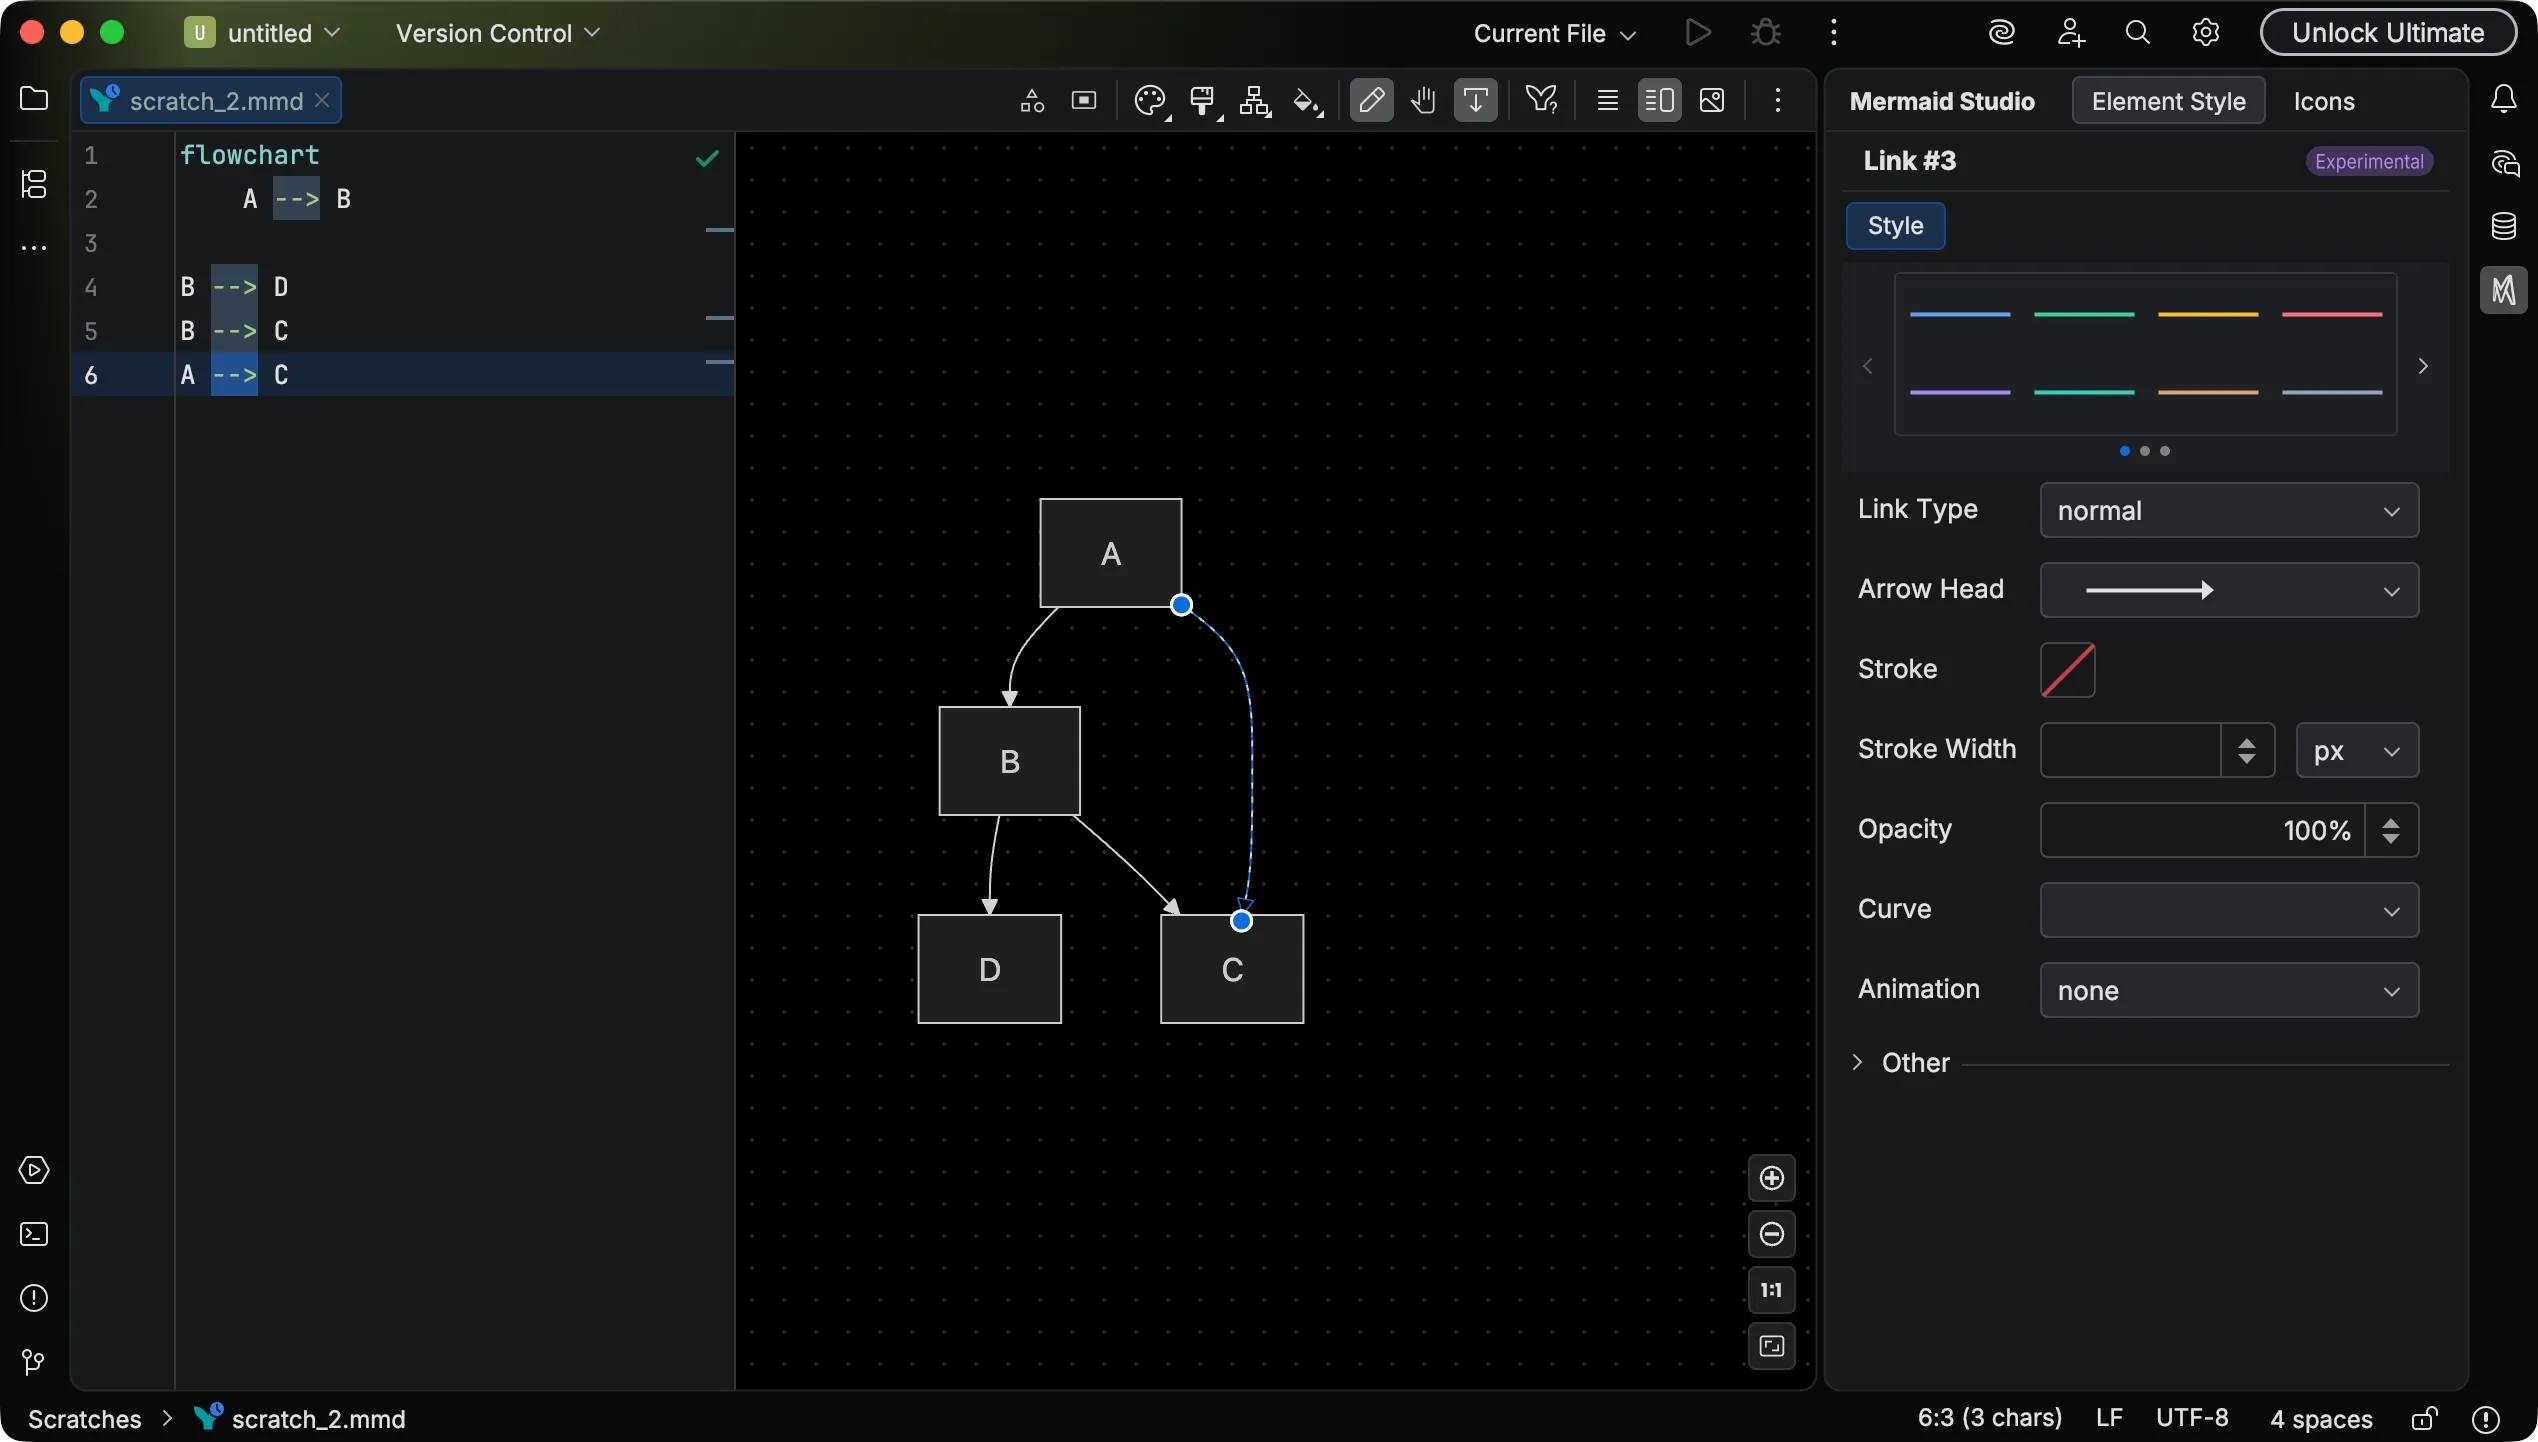
Link styling
Section titled “Link styling”When a link (edge) is selected, the Style Pane shows link-specific styling controls.
Changes are written as linkStyle declarations in the diagram source.
If a linkStyle declaration already exists for the selected link, the Style Pane updates it in place; otherwise a new declaration is added.
You can navigate between links and their linkStyle declarations using Go to Related (
Click-handler properties
Section titled “Click-handler properties”When a node is selected, the Style Pane shows a Link tab for editing click-handler properties. This tab is only visible for nodes.
| Property | Description |
|---|---|
URL | The destination URL for the click handler |
Tooltip | Hover text shown over the node |
Target | Link target (_self, _blank, _parent, or _top) |
The Tooltip and Target fields are disabled until a URL is set.
Setting a URL creates a click statement in the diagram source (for example, click A href "https://example.com" "My tooltip" _blank).
If the node already has a click handler (including a JavaScript callback), it is replaced.
Clearing the URL removes the click statement entirely.
Adding nodes
Section titled “Adding nodes”Click Add Node in the toolbar to open the shape picker. The picker is organized into tabs (Basic, Process, Technical) showing the available node shapes with visual previews.
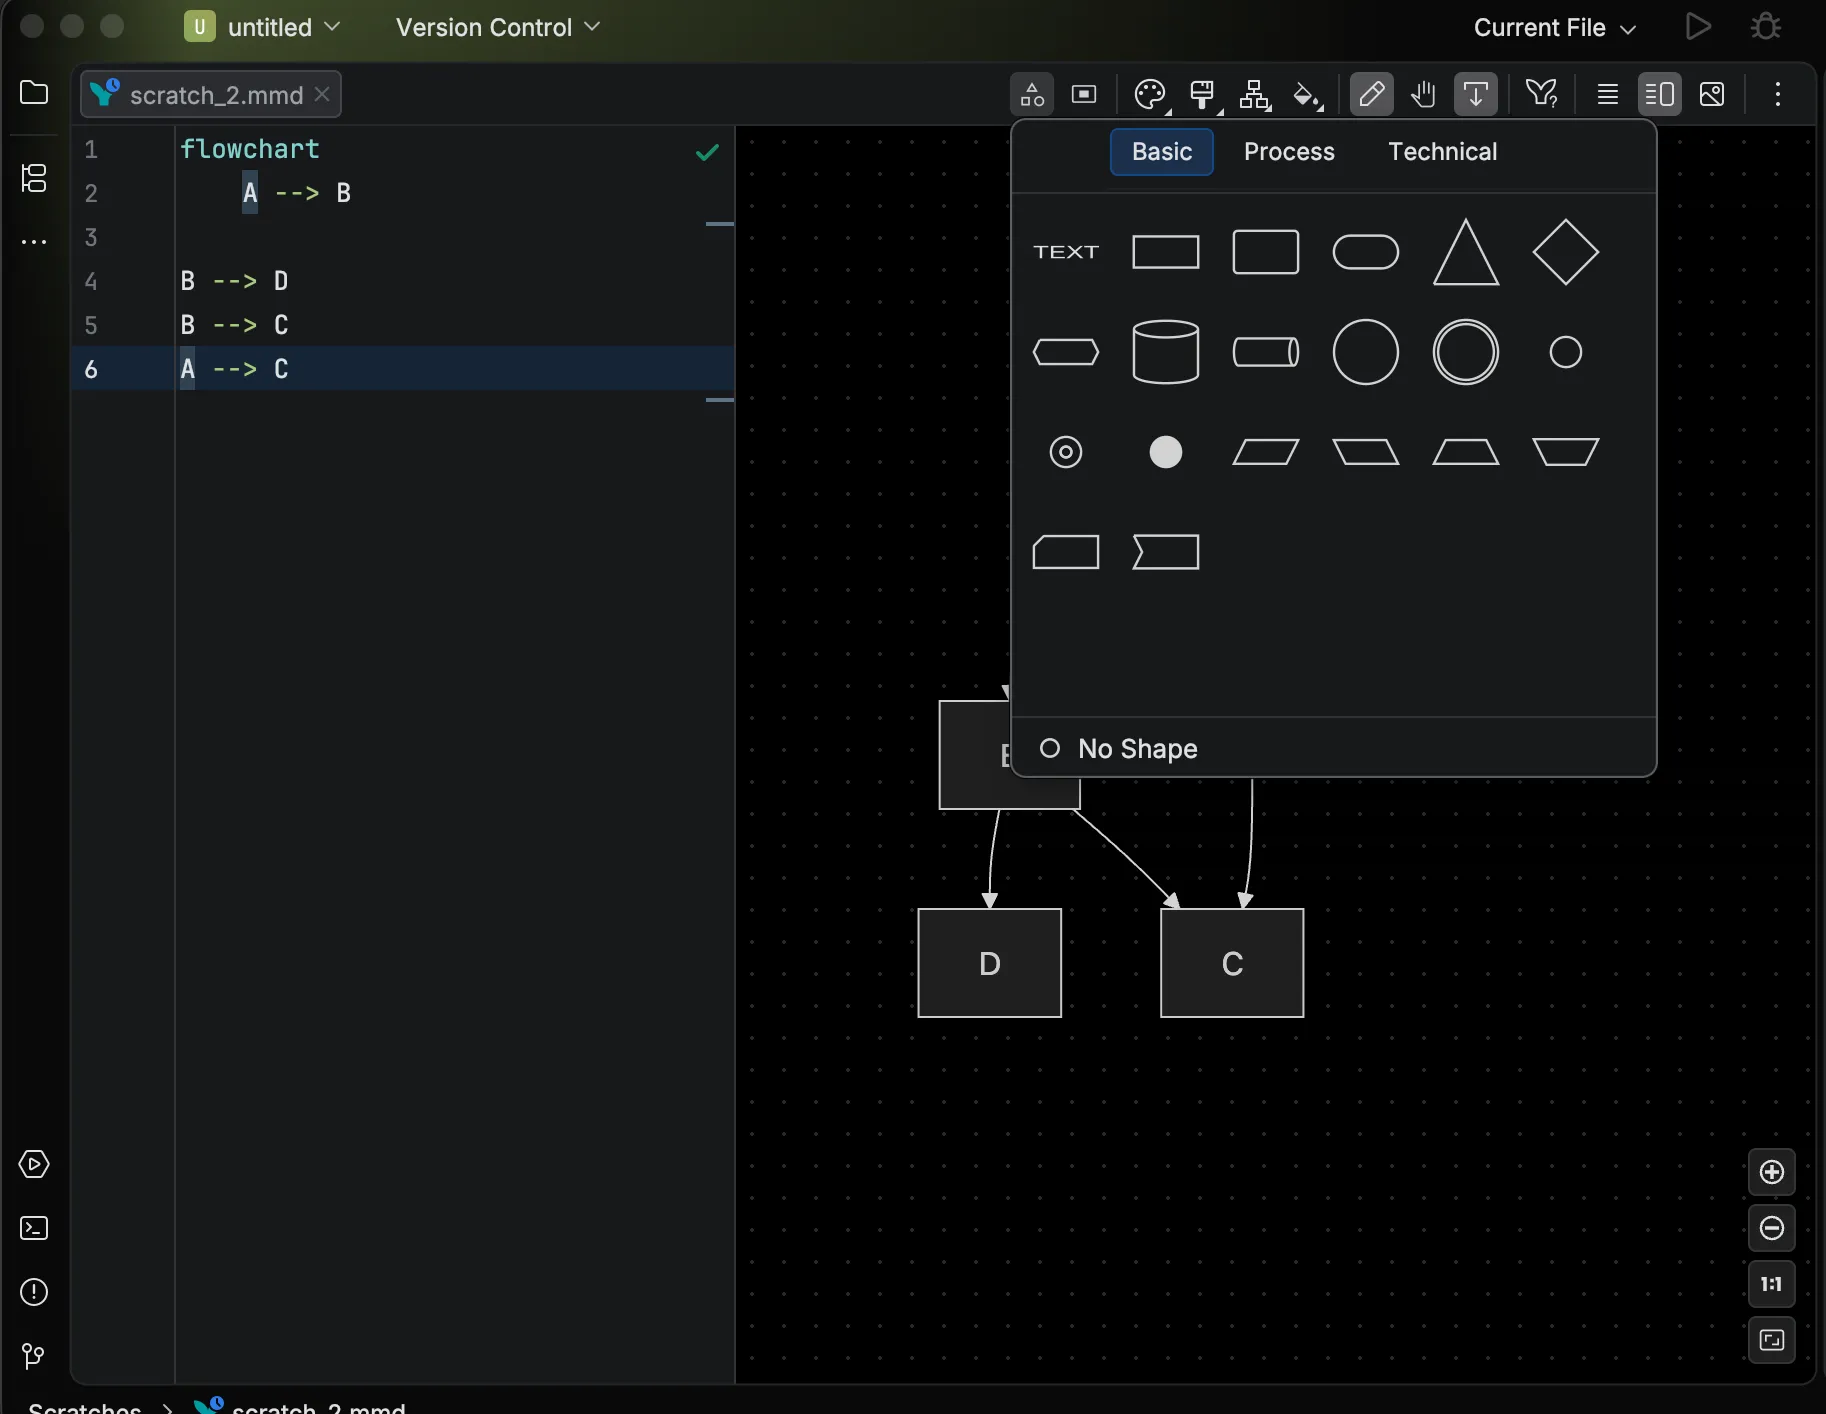
Select a shape to insert a new node into the diagram source. The editor caret moves to the new node so you can immediately type its label.
Adding subgraphs
Section titled “Adding subgraphs”Click Add Subgraph in the toolbar to insert a new subgraph container into the diagram source.
Drag to add with shape
Section titled “Drag to add with shape”Drag the connection handle on a node to an empty area of the canvas. A shape picker appears at the drop location, lets you choose the shape, then inserts the new node connected to the source node by a new edge.
Connecting elements
Section titled “Connecting elements”Hover over a node in edit mode to reveal a connection handle. Drag from the handle to a target node to create a new edge between them. The corresponding edge syntax is added to the diagram source automatically.
Edge retargeting
Section titled “Edge retargeting”Drag an existing edge’s endpoint to a different node to change where the connection points. The source code is updated to reflect the new target.
Moving elements
Section titled “Moving elements”Click and drag a selected node to reposition it. The source code is updated to reflect the new position.
- Moving nodes between subgraphs — drag a node into or out of a subgraph to change its scope. When a node crosses a subgraph boundary, the source code structure is updated accordingly.
- Moving subgraphs — click a subgraph to select it first, then drag. You can drag a subgraph into another subgraph to nest it.
With multiple elements selected, dragging moves all selected elements together as a batch.
Grouping into a subgraph
Section titled “Grouping into a subgraph”Select one or more nodes and press
Subgraph selection shortcuts
Section titled “Subgraph selection shortcuts”Alt + Shift + P AltShiftP Alt + Shift + P AltShiftP selects the parent subgraph of the current selection.Alt + Shift + C AltShiftC Alt + Shift + C AltShiftC selects all children of the currently selected subgraph.Alt + Shift + S AltShiftS Alt + Shift + S AltShiftS selects all siblings at the same nesting level as the current selection.
Inline label editing
Section titled “Inline label editing”In flowcharts, inline label editing applies to node labels, subgraph titles, and edge labels.
Double-click one, type the new text, and commit with
Quick Syntax Reference
Section titled “Quick Syntax Reference”Directions:
TDorTB- Top to bottomLR- Left to rightRL- Right to leftBT- Bottom to top
Node shapes:
[Text]- Rectangle([Text])- Stadium/pill{Text}- Diamond (decision)[/Text/]- Parallelogram (input/output)((Text))- Circle
Generalized shape syntax (A@{ shape: datastore }) covers the upstream catalog, including the new datastore shape (Mermaid 11.15.0+, with data-store as an alias).
The plugin classifies it under the Technical category in shape completion and flags it on pre-11.15.0 runtimes with a version annotation.
Edges:
-->- Arrow---- Line-.->- Dotted arrow==>- Thick arrow-->|Label|- Arrow with textanimate A --> B- Animated edge
Subgraphs:
flowchart LR subgraph Backend API --> DB end subgraph Frontend UI --> API endFor the complete syntax reference, see the Mermaid.js Flowchart documentation.