
Gantt Chart
Last updated:
Mermaid Studio provides language support for Gantt charts inside IntelliJ IDEA and other JetBrains IDEs. Gantt charts visualize project schedules, showing tasks, their durations, and dependencies over time, and are essential for project planning, tracking milestones, and communicating timelines to stakeholders.
Syntax Highlighting
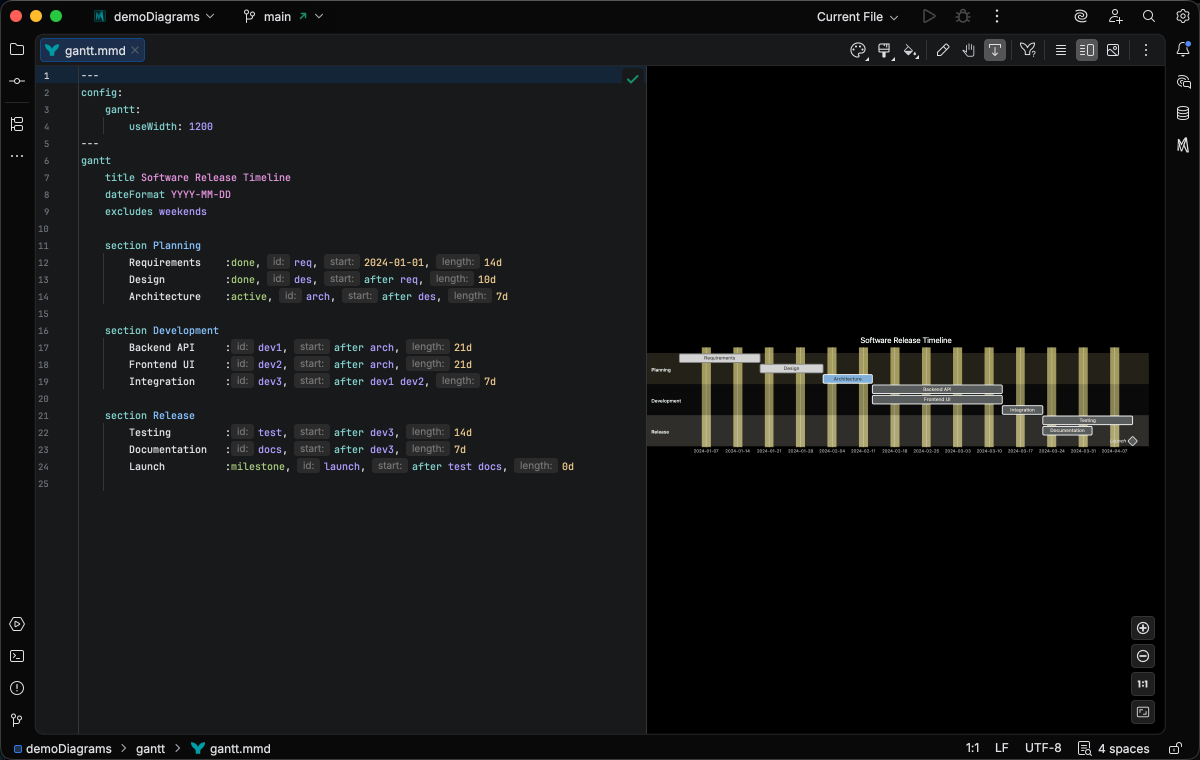
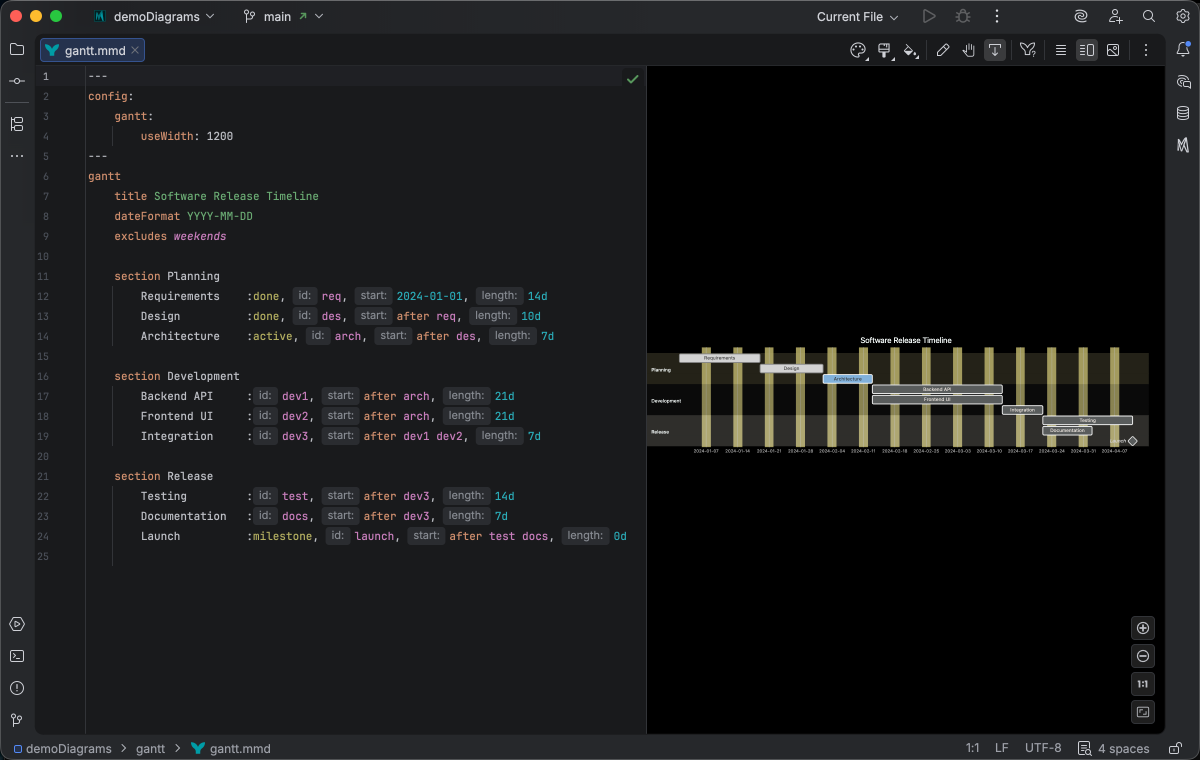
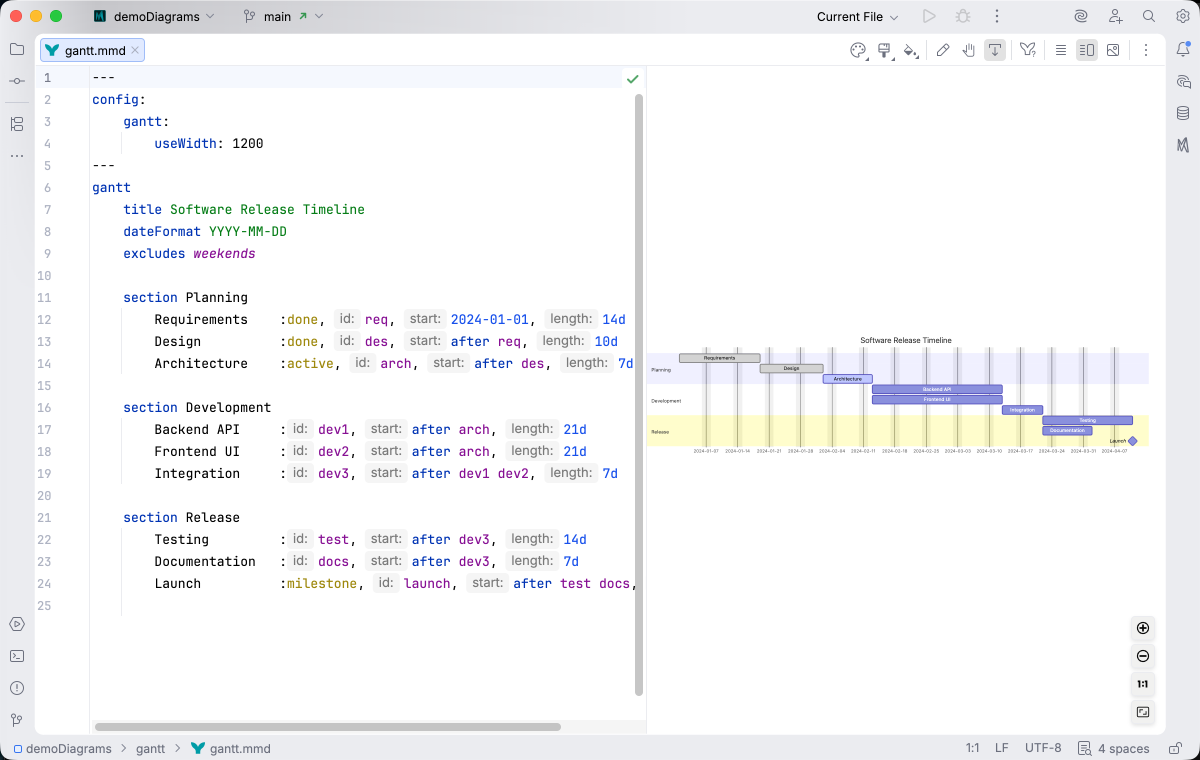
Section titled “Syntax Highlighting”Syntax highlighting integrates directly with IntelliJ’s color scheme system, so diagram colors always match your editor theme.
IDE Support
Section titled “IDE Support”The summary below shows the IDE support Mermaid Studio ships for Gantt charts, grouped by capability.
Folding lets you collapse and expand structural blocks of the diagram source (subgraphs, frontmatter, multi-line strings) directly in the editor gutter. It keeps long diagrams navigable without forcing you to scroll past detail you don’t need right now.
Use the gutter triangles, Code → Folding, or the standard JetBrains shortcuts (
The line-comment action (
When you type a quote character to start a string, Mermaid Studio inserts the matching closing quote and places the cursor between them. Backspacing through an empty pair removes both characters at once. This keeps quoted labels balanced and reduces fiddly cursor work.
The formatter rewrites your diagram source to a canonical layout (consistent indentation, alignment of multi-line links, normalized whitespace around operators) without changing semantics.
It also clears up the whitespace mistakes that the Mermaid.js parser is picky about, normalizing spacing between tokens so the parser accepts the diagram on the first read instead of throwing a confusing syntax error.
Run it with Code → Reformat Code (
Pressing
A dedicated Grammar-Kit parser backs the highlighting, so tokens are colored by what they mean in the diagram (a type reference versus a label versus a style), not just what they look like. The same parser validates the syntax as you type, flagging malformed statements in place instead of letting one mistake cascade through the file.
This is the foundation richer features build on; the same grammar drives completions, refactoring, and inspections.
Per-diagram annotators apply rule-based highlighting above the lexer and parser, running on every keystroke and painting their results directly in the editor. Mermaid Studio uses them across the full range the platform supports: highlighting that token types alone cannot decide (coloring a reference by what it resolves to), semantic errors and warnings (an edge pointing at an undefined node, an invalid direction value), and inline cues such as marking duplicate labels. Unlike inspections (configurable checks listed in Settings), annotators are always on, whether a rule ends in a color or a warning.
As you type, Mermaid Studio offers context-aware suggestions filtered to what’s valid at the cursor: node shapes, arrow types, keywords, icon names, identifiers, frontmatter keys, theme variables, and more. Completions cut down on typos and make the diagram syntax self-documenting.
Completion and validation for the YAML frontmatter block above the diagram body, driven by the diagram type’s slice of the Mermaid.js config schema. Config keys, enum values, and color properties complete as you type, and unknown or mistyped keys are flagged in place.
Inlay hints are small inline annotations rendered between tokens, such as parameter names on call sites or counts on summary nodes. They’re configurable per language under Settings → Editor → Inlay Hints.
Inspections are static analyzers that run continuously and surface problems as you edit: duplicate IDs, undefined references, malformed syntax, deprecated patterns, missing required fields. Each inspection has a configurable severity (error, warning, info), can be suppressed inline, and most ship with a quick fix that resolves the issue with one keystroke.
This is where most of the editorial intelligence lives: a diagram type with rich inspections is much harder to break in subtle ways.
Rename refactoring (
Bundled and user-authored color themes with light and dark variants that apply to this diagram type from the Appearance menu or the Switch Diagram Theme action. Applying a theme writes the resolved theme variables into the diagram’s frontmatter, so the file renders the same outside the IDE.
Inlay hints show each task’s calculated start date and duration inline, so you can read the resolved schedule without leaving the source.
Quick Syntax Reference
Section titled “Quick Syntax Reference”gantt title My Project dateFormat YYYY-MM-DD
section Planning Task 1 :t1, 2024-01-01, 7d Task 2 :t2, after t1, 5d
section Execution Milestone :milestone, m1, after t2, 0d Task 3 :active, t3, after m1, 10d Task 4 :crit, t4, after t3, 14dKey elements:
title- Set the chart titledateFormat- Specify date format (e.g.,YYYY-MM-DD)section- Group related tasks:id, start, duration- Define task timingafter taskId- Create dependenciescrit,active,done- Task status markers
For complete syntax details, see the Mermaid.js Gantt documentation.