Quadrant Chart
Last updated:
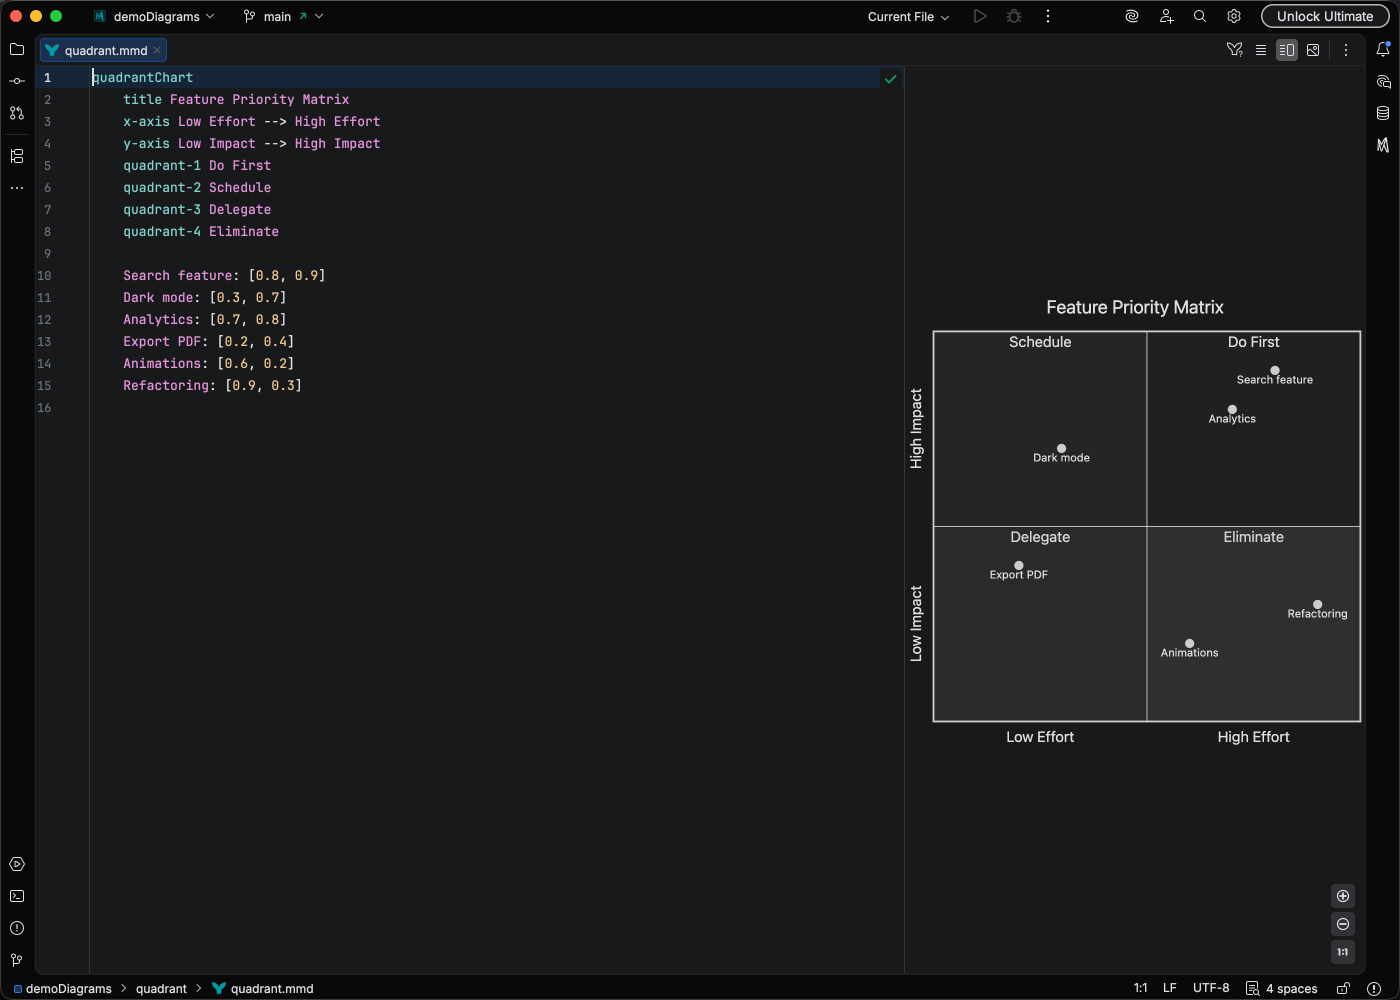
Quadrant charts divide a space into four sections based on two axes. They are perfect for priority matrices, risk assessments, and strategic analysis frameworks like the Eisenhower Matrix.
Syntax Highlighting
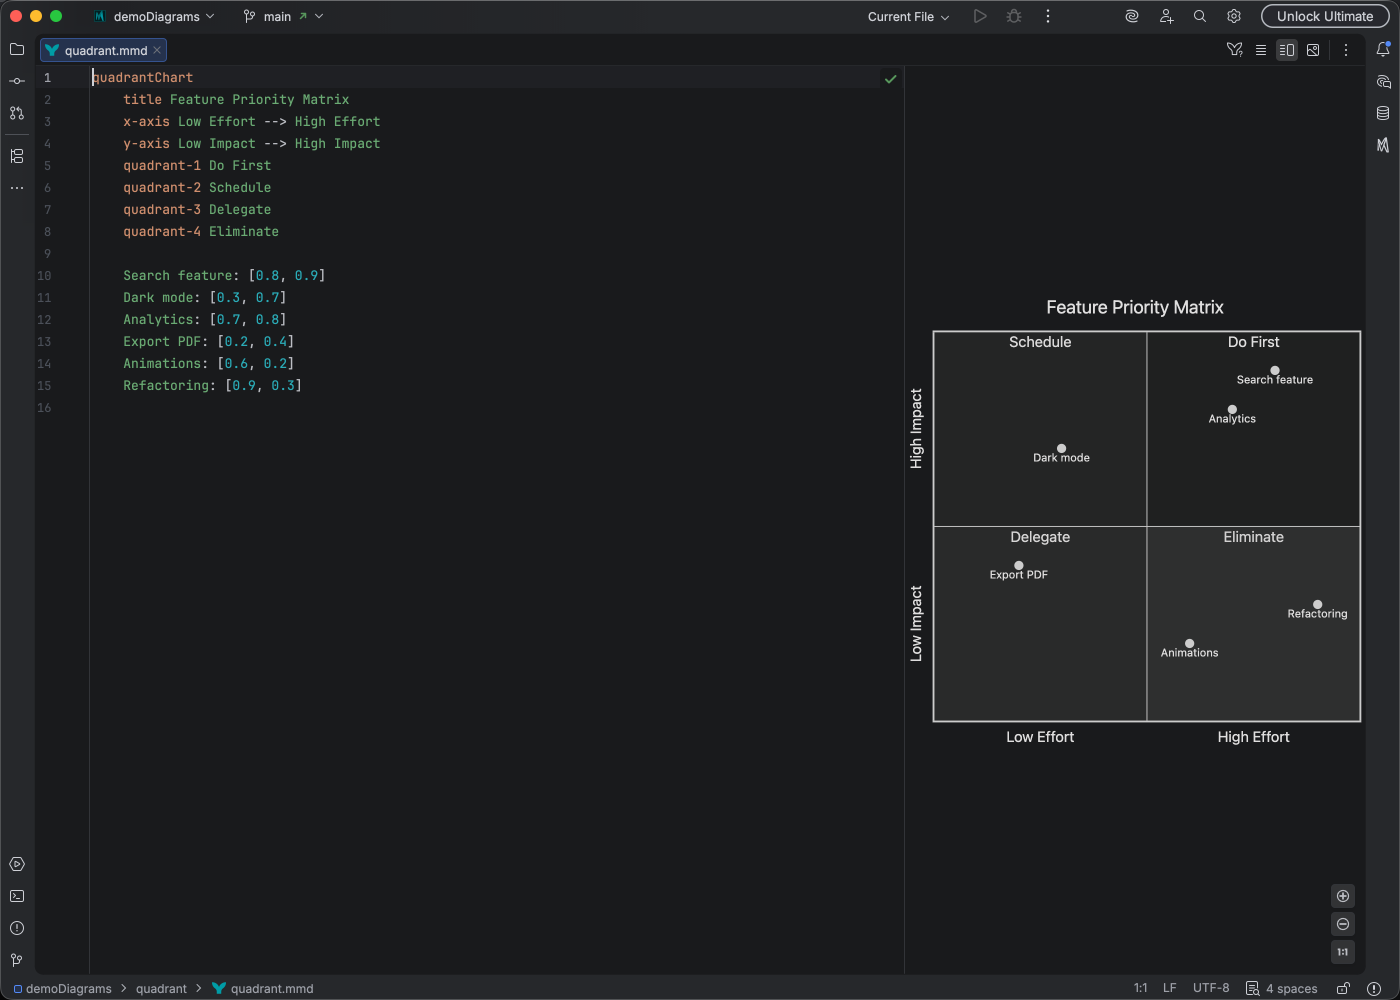
Section titled “Syntax Highlighting”Syntax highlighting integrates directly with IntelliJ’s color scheme system, so diagram colors always match your editor theme.
IDE Support
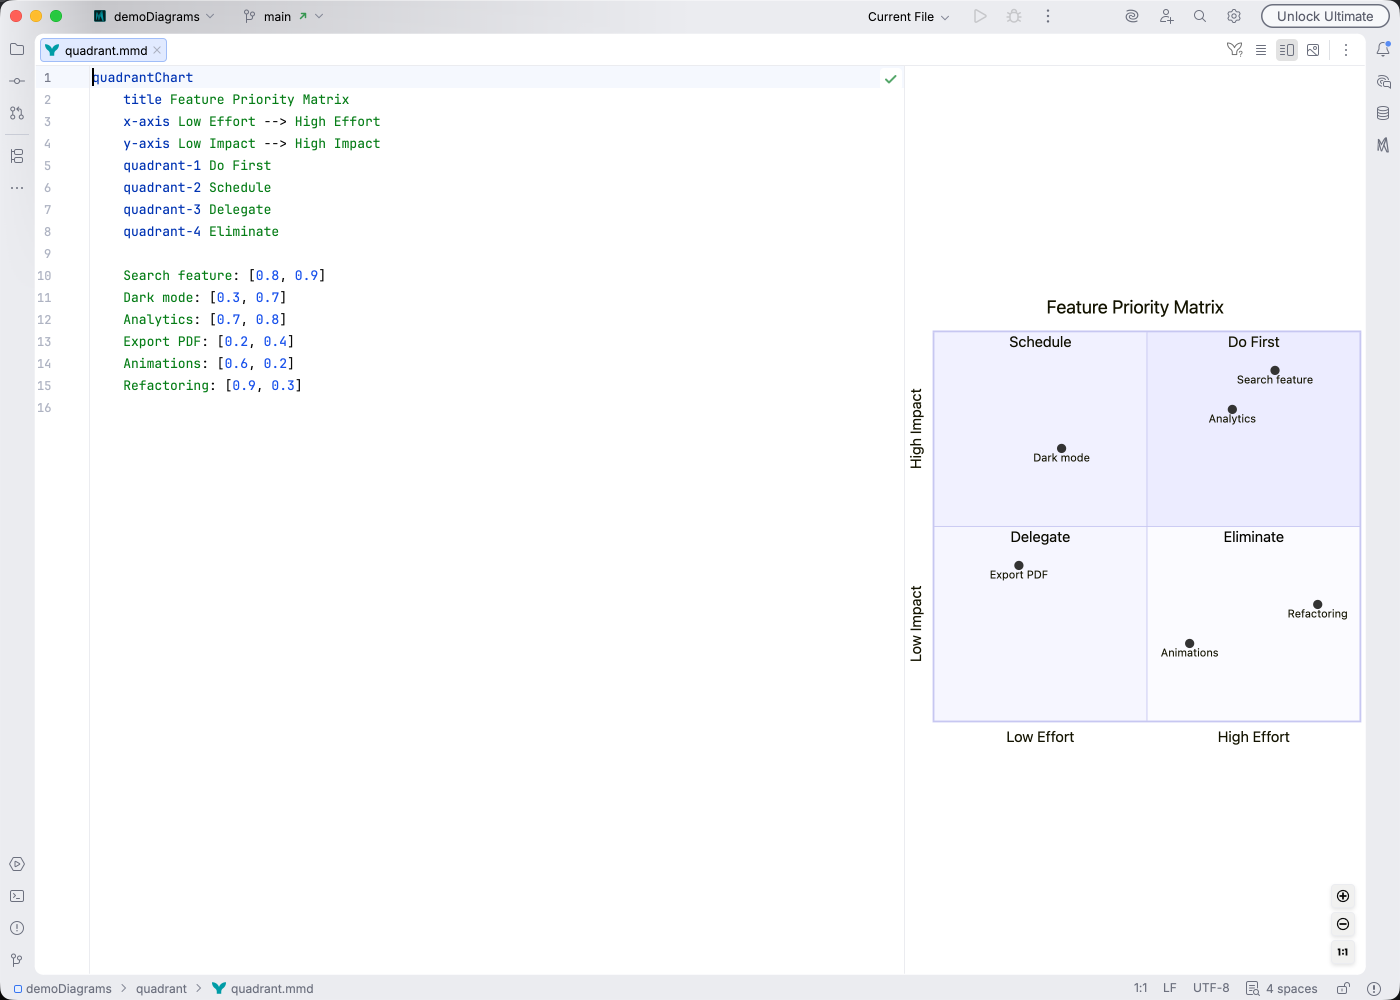
Section titled “IDE Support”Mermaid Studio provides enhanced support for quadrant charts:
- Syntax highlighting for axes, quadrants, and points
- Find usages to locate point references
- Inspections to validate chart structure
- Code Vision showing element counts
- Color provider for styling customization
Quick Syntax Reference
Section titled “Quick Syntax Reference”Chart Structure
Section titled “Chart Structure”quadrantChart title Chart Title x-axis Left Label --> Right Label y-axis Bottom Label --> Top Label quadrant-1 Top Right Name quadrant-2 Top Left Name quadrant-3 Bottom Left Name quadrant-4 Bottom Right NamePlotting Points
Section titled “Plotting Points”Points are defined with a name and coordinates:
Point Name: [x, y]Coordinates range from 0 to 1:
[0, 0]is bottom-left[1, 1]is top-right[0.5, 0.5]is center
Common Use Cases
Section titled “Common Use Cases”- Priority Matrix: Effort vs Impact
- Risk Assessment: Likelihood vs Severity
- Feature Planning: Value vs Complexity
- Skill Mapping: Competence vs Interest
For full syntax details, see the Mermaid quadrant chart documentation.