Radar Chart
Last updated:
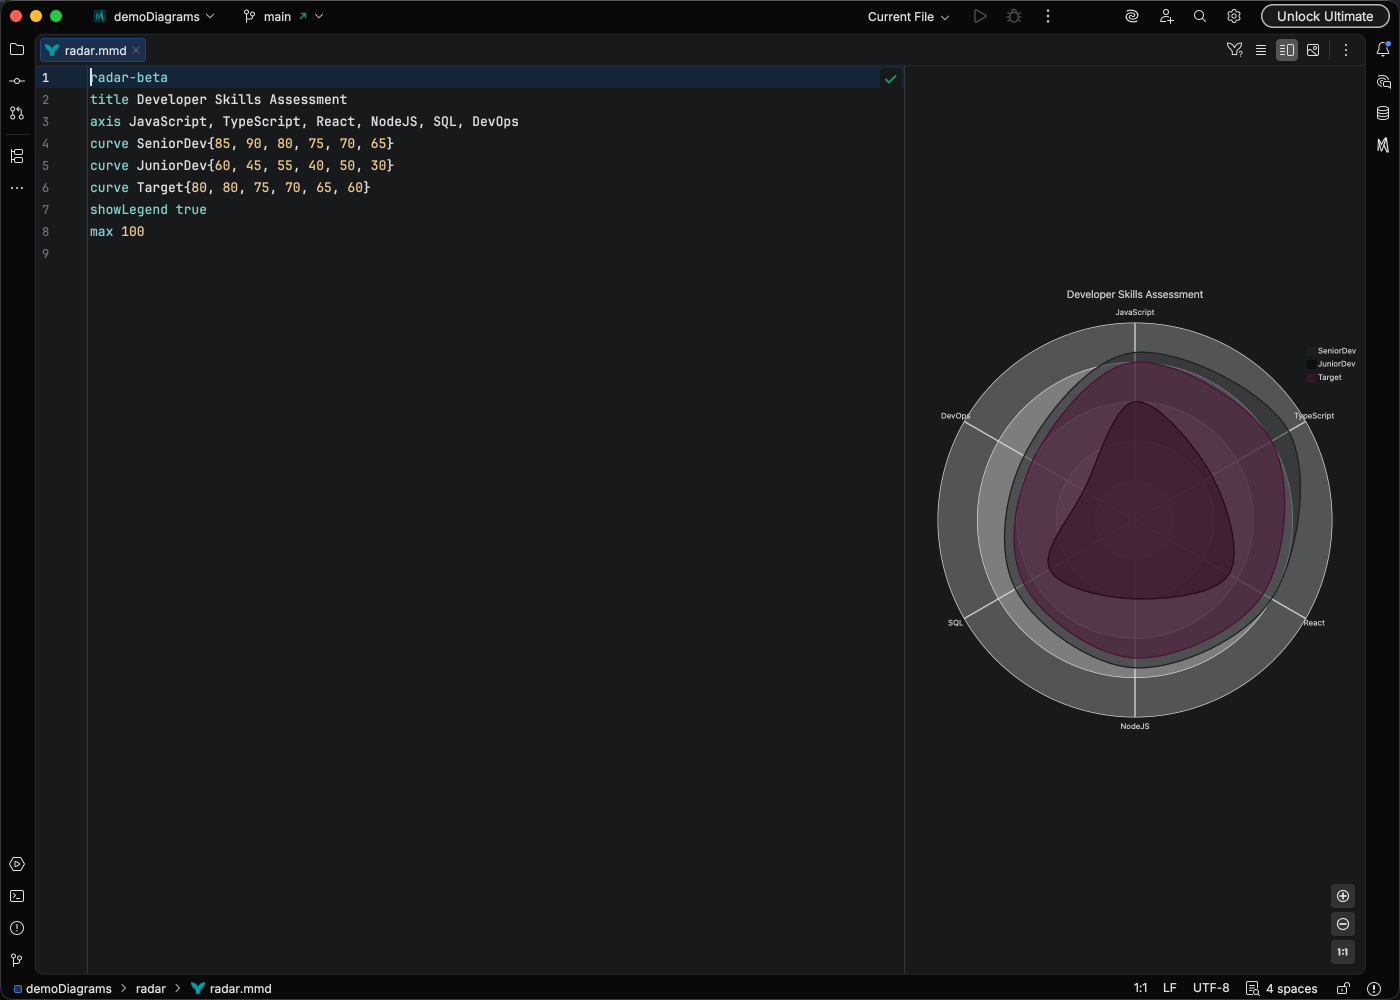
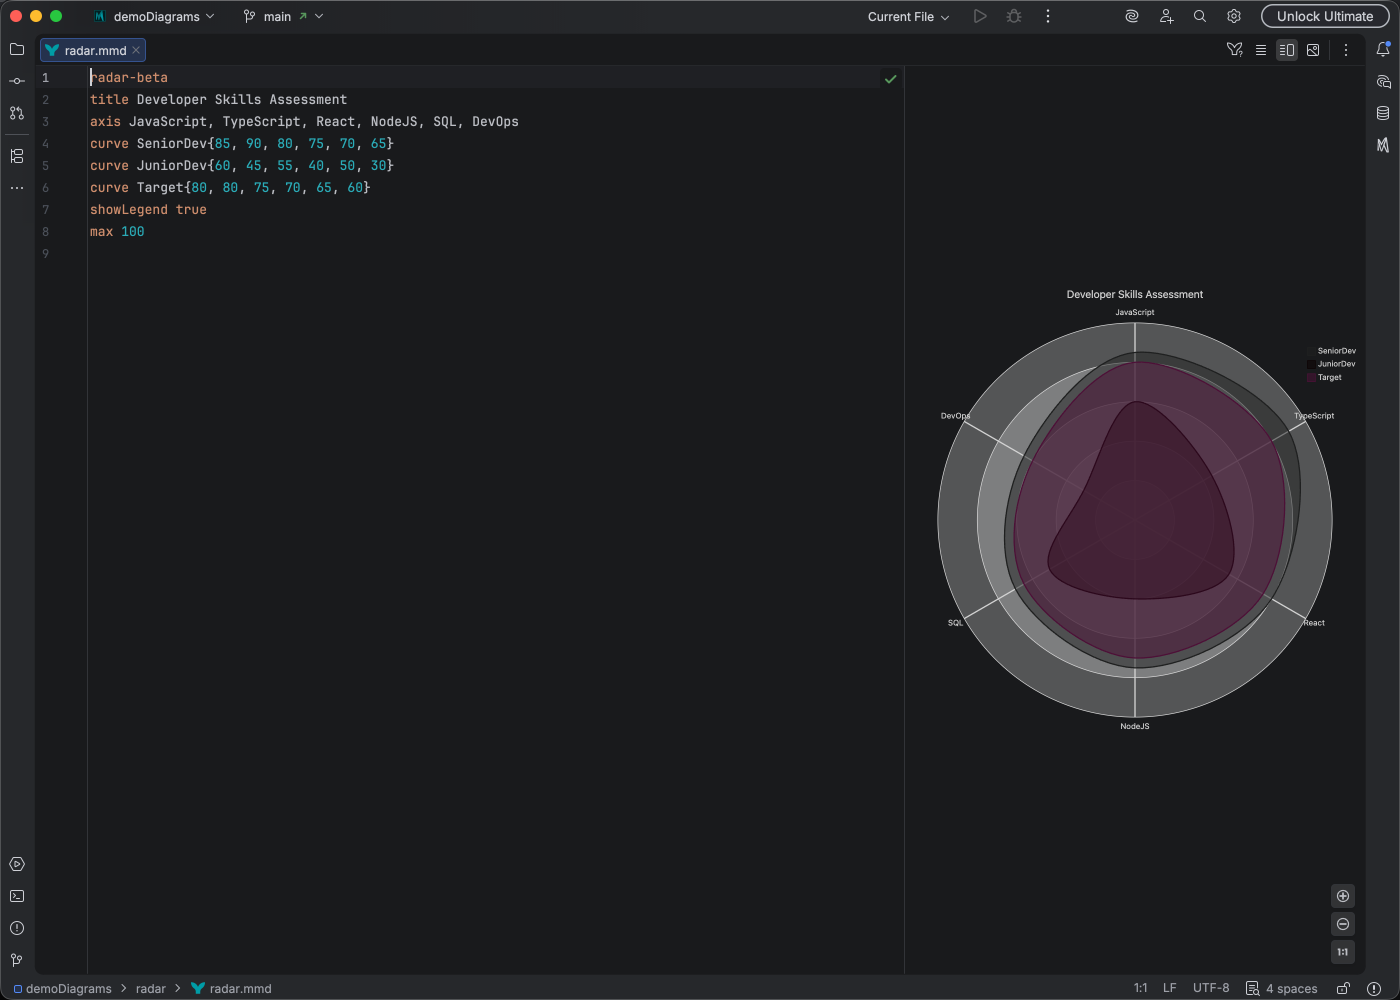
Radar charts (also called spider charts) display multivariate data on axes starting from a common center point.
Syntax Highlighting
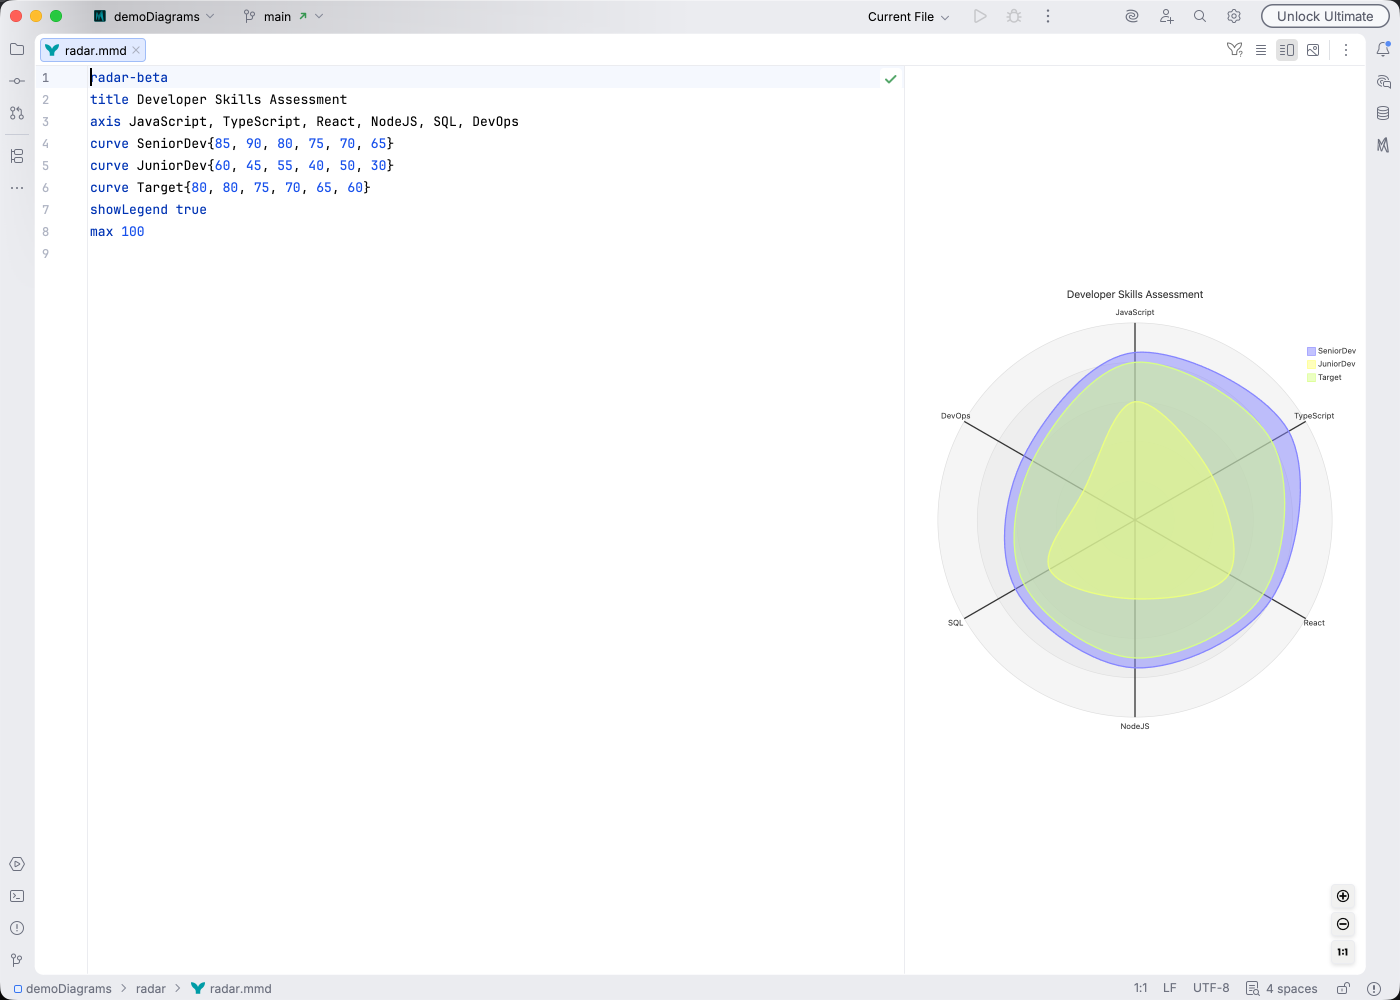
Section titled “Syntax Highlighting”Syntax highlighting integrates directly with IntelliJ’s color scheme system, so diagram colors always match your editor theme.
IDE Support
Section titled “IDE Support”Mermaid Studio provides enhanced support for radar charts:
- Syntax highlighting for axes and data curves
- Rename refactoring to update axis and curve names
- Find usages to locate references
- Code folding to collapse sections
- Brace matching for data definitions
Learn More
Section titled “Learn More”For complete syntax documentation including multiple curves and axis configuration, see the Mermaid.js Radar documentation.