Sankey Diagram
Last updated:
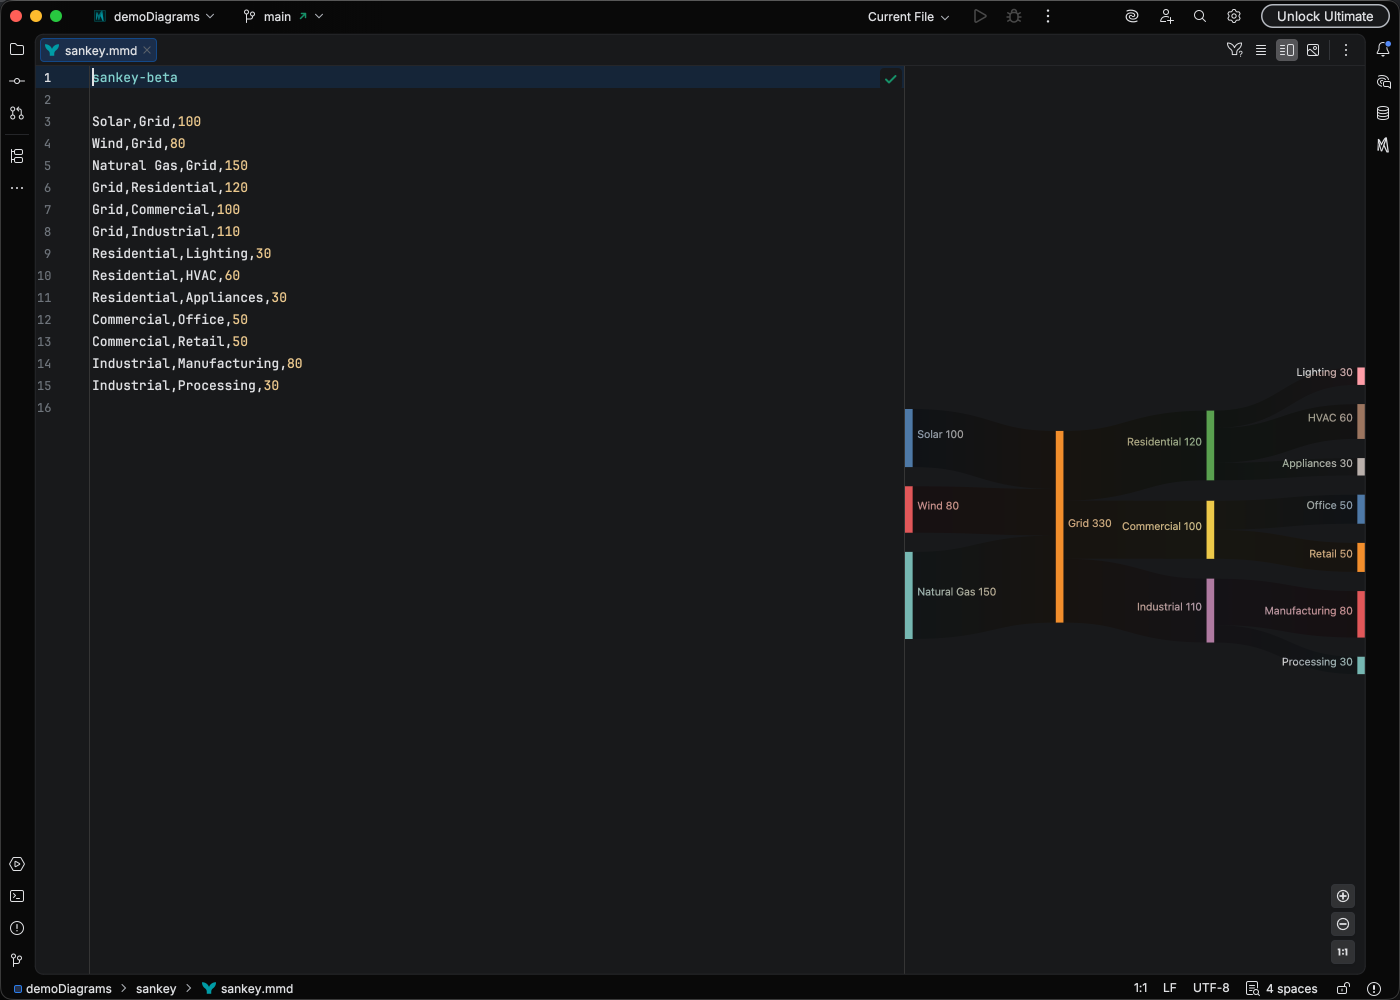
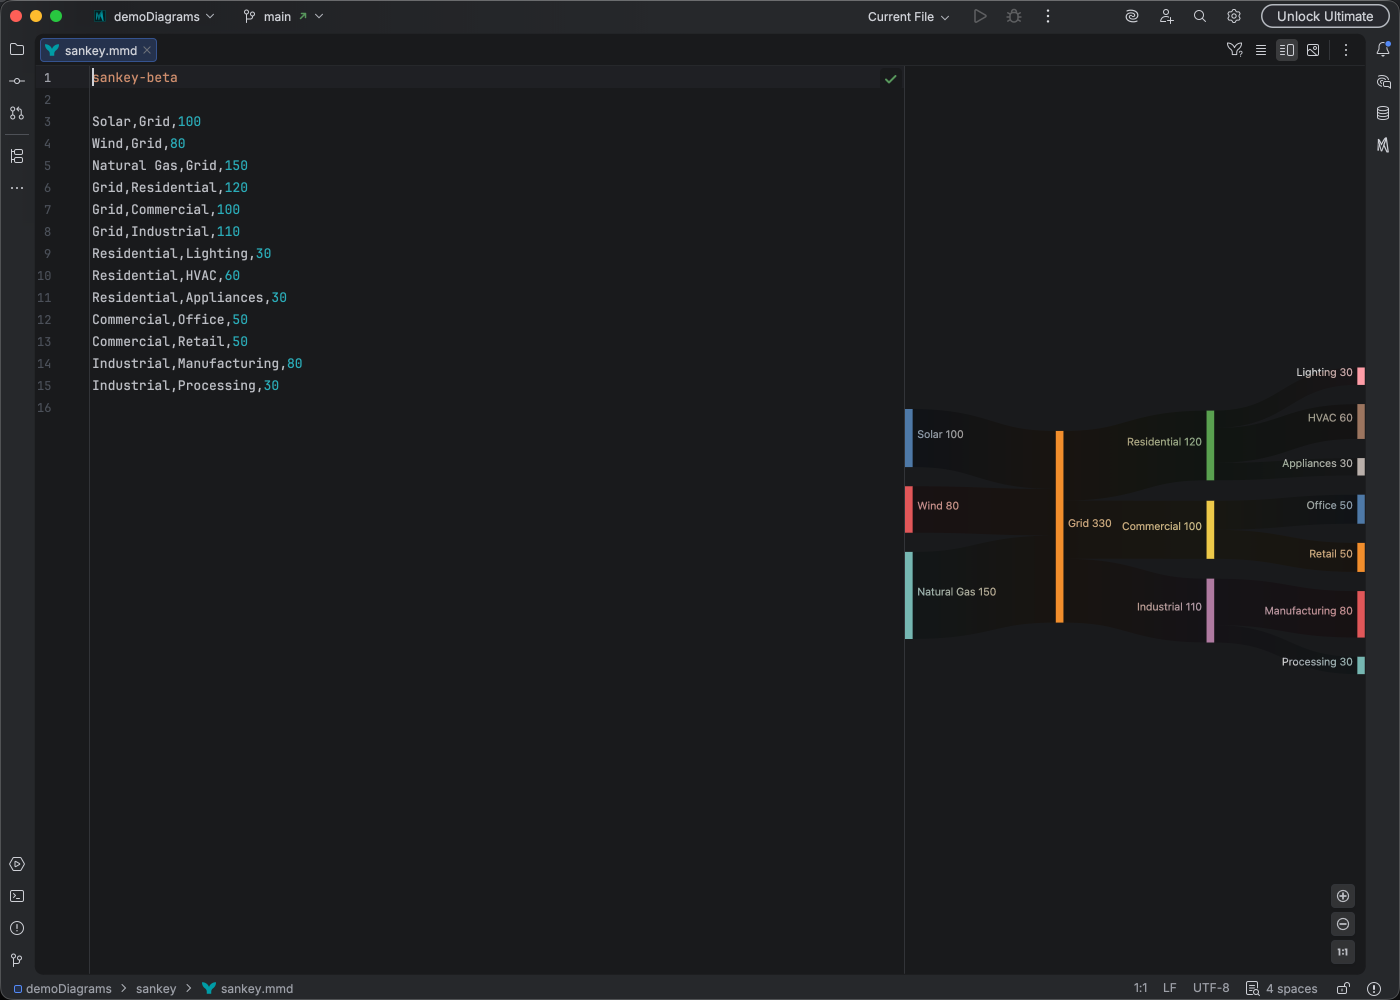
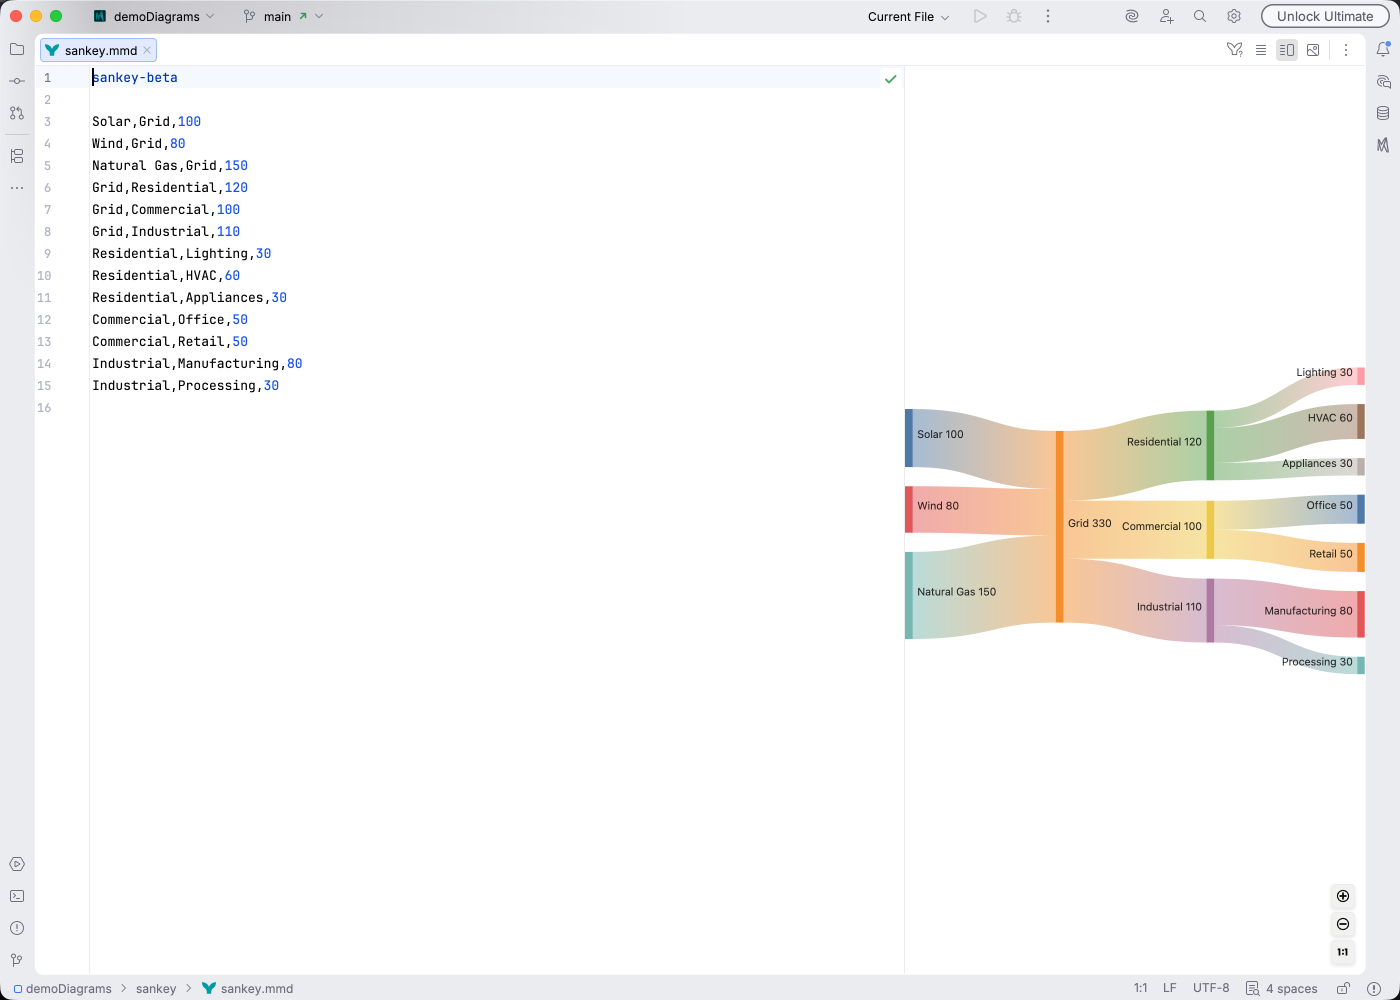
Sankey diagrams visualize flows between nodes where the arrow width represents the quantity or magnitude. They are ideal for showing energy transfers, budget allocations, or user journey flows.
Syntax Highlighting
Section titled “Syntax Highlighting”Syntax highlighting integrates directly with IntelliJ’s color scheme system, so diagram colors always match your editor theme.
IDE Support
Section titled “IDE Support”Mermaid Studio provides enhanced support for Sankey diagrams:
- Syntax highlighting for nodes and flows
- Code completion for node name references
- Rename refactoring to update node names
- Find usages to locate where nodes are referenced
- Inspections to validate diagram structure
Quick Syntax Reference
Section titled “Quick Syntax Reference”Basic Flow Syntax
Section titled “Basic Flow Syntax”Each line defines a flow with three comma-separated values:
Source,Target,Value- Source: The origin node name
- Target: The destination node name
- Value: The numeric flow quantity (determines arrow width)
Multiple Flows
Section titled “Multiple Flows”sankey-beta Source A,Target 1,100 Source A,Target 2,50 Source B,Target 2,75 Target 1,Final,100 Target 2,Final,125- Larger values create wider arrows
- Nodes are automatically created when referenced
- Flows can chain through intermediate nodes
- Use descriptive node names for clarity
For full syntax details, see the Mermaid Sankey documentation.