XY Chart
Last updated:
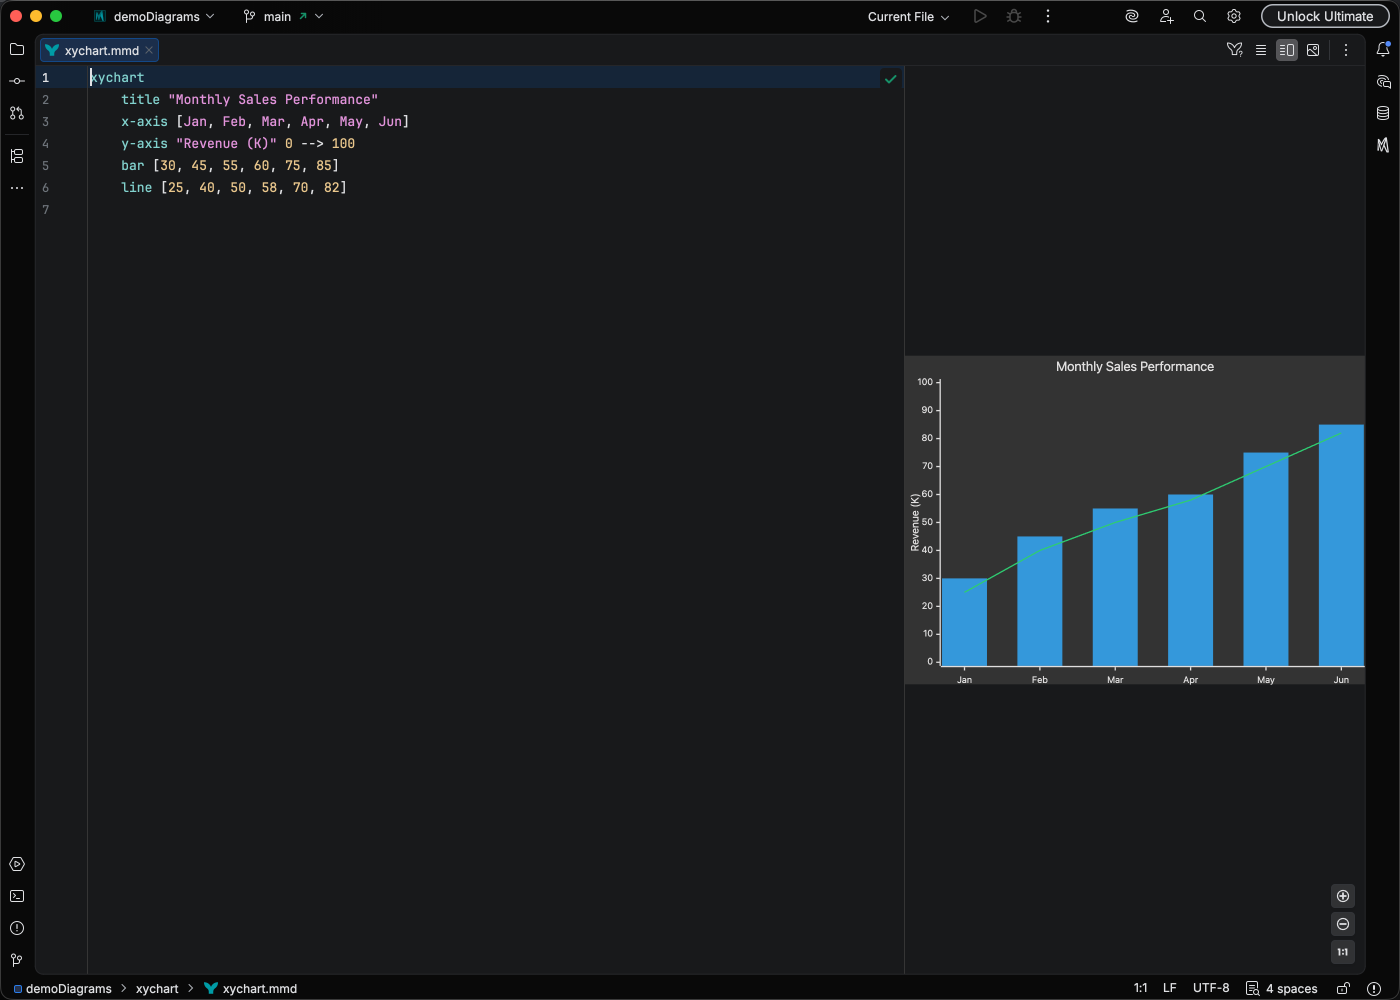
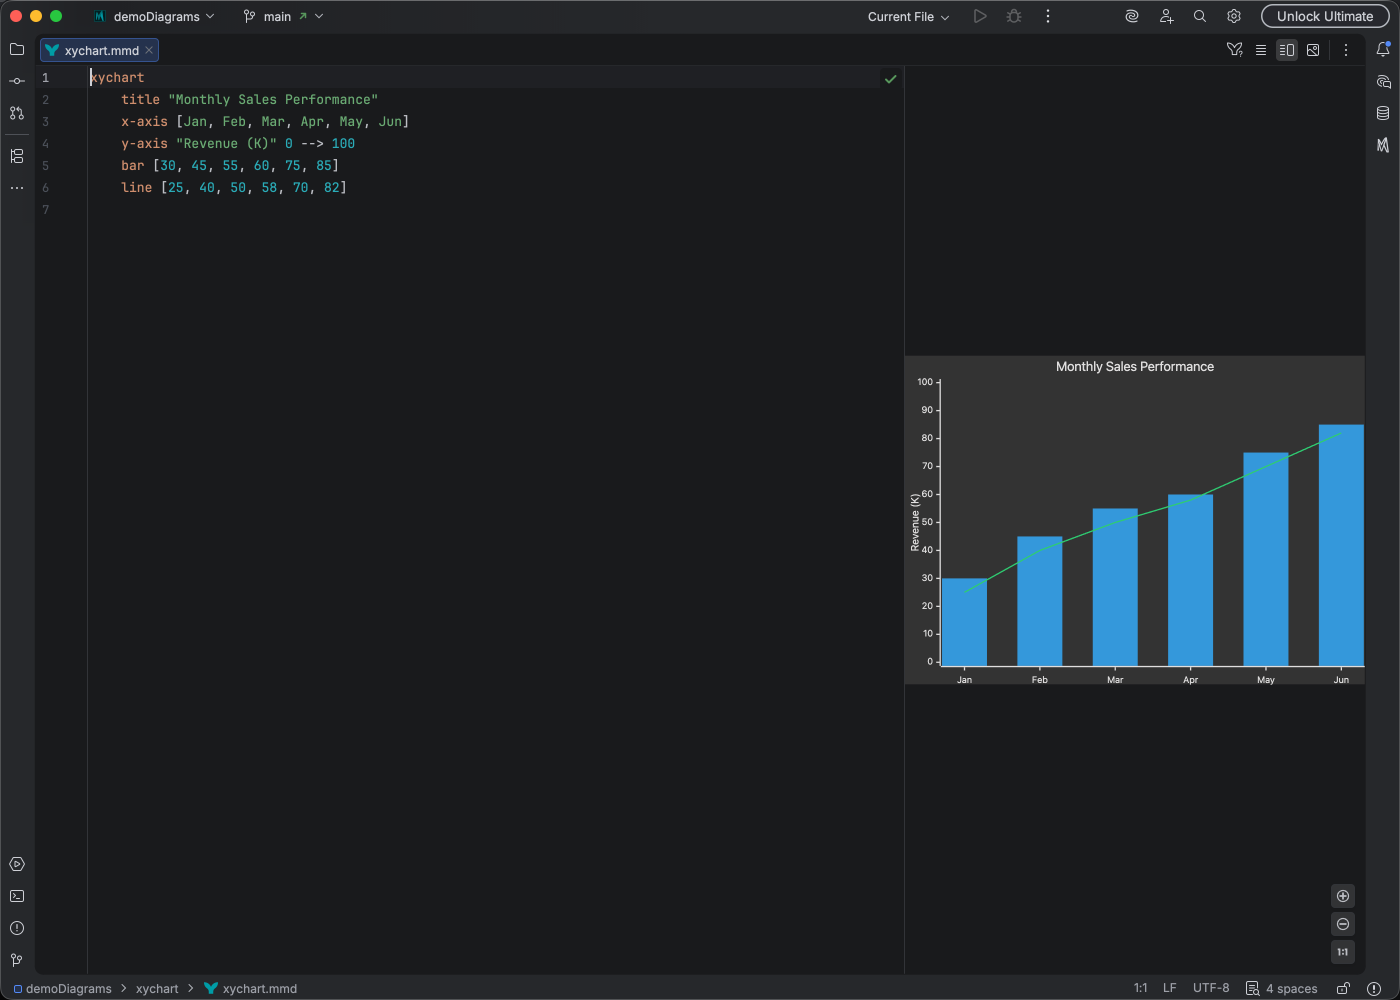
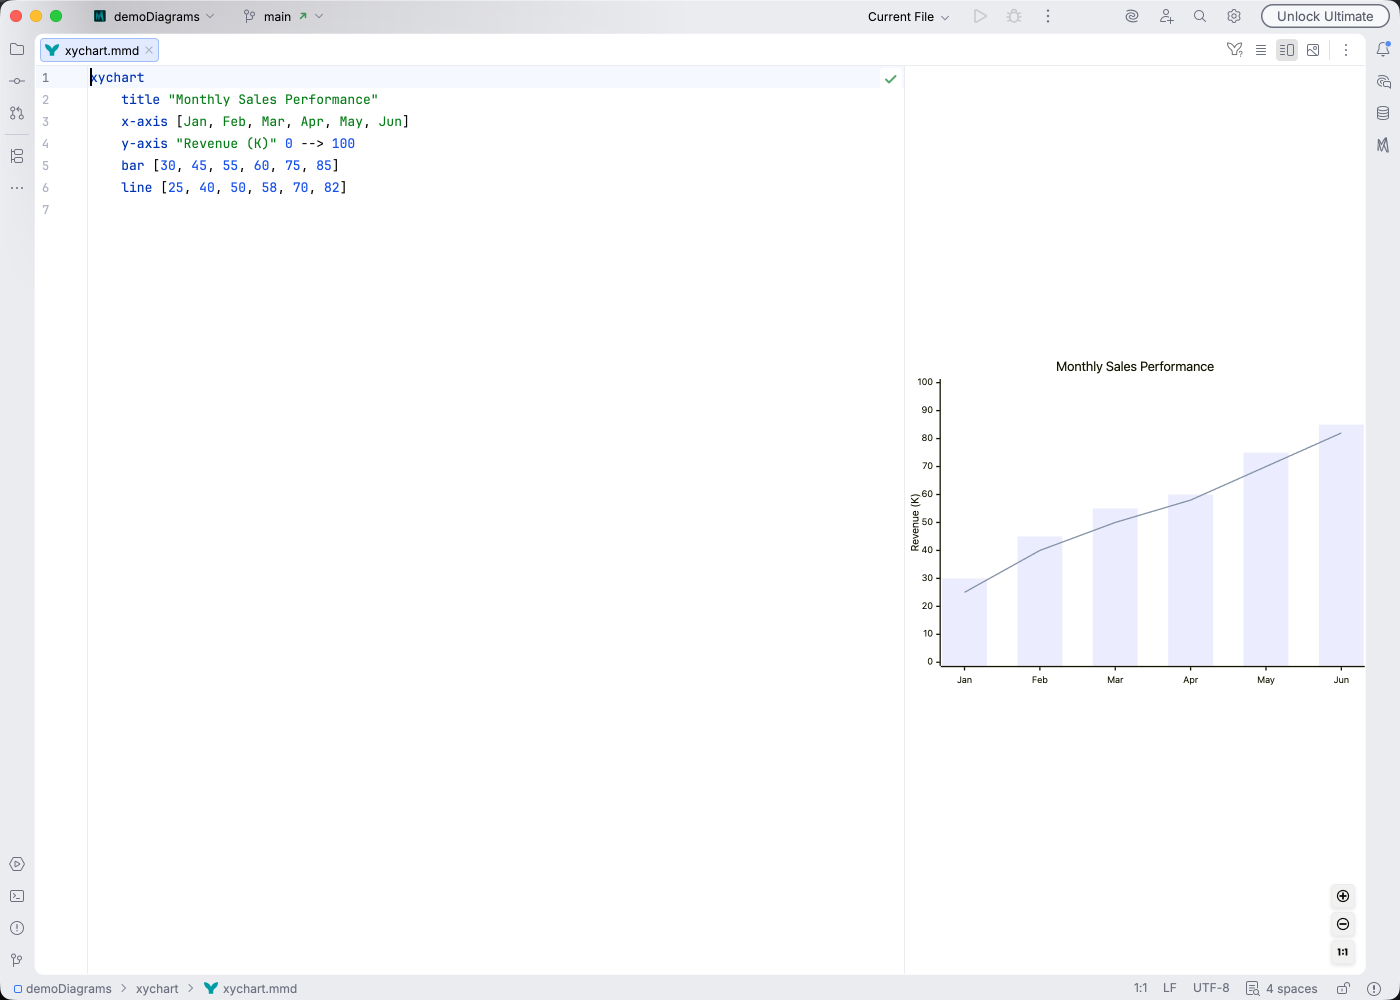
XY charts provide general-purpose data visualization with support for bar charts, line charts, or combinations of both.
Syntax Highlighting
Section titled “Syntax Highlighting”Syntax highlighting integrates directly with IntelliJ’s color scheme system, so diagram colors always match your editor theme.
IDE Support
Section titled “IDE Support”Mermaid Studio provides support for XY charts:
- Syntax highlighting for axes, data series, and titles
- Code completion for diagram keywords and chart orientation
- Brace matching for data array boundaries
- Code formatter with configurable base indent, comma spacing, arrow spacing, and bracket content collapsing. Multi-line bracket content aligns continuation lines to the opening bracket
- Error detection for invalid syntax
- Inspections to detect duplicate axis declarations, data values outside the declared y-axis range, and x-axis declarations after data that cause incorrect rendering
- Quick fixes to expand the y-axis range when data values fall outside it
Learn More
Section titled “Learn More”For complete syntax documentation including multiple data series and axis configuration, see the Mermaid.js XY Chart documentation.